The Bespoke Report — 6/30/17
The Closer 6/30/17 – End of Week Charts
Looking for deeper insight on global markets and economics? In tonight’s Closer sent to Bespoke clients, we recap weekly price action in major asset classes, update economic surprise index data for major economies, chart the weekly Commitment of Traders report from the CFTC, and provide our normal nightly update on ETF performance, volume and price movers, and the Bespoke Market Timing Model. This week, we’ve added a section that helps break down momentum in developed market foreign exchange crosses.

The Closer is one of our most popular reports, and you can sign up for a free trial below to see it!
Click here to start your no-obligation two-week free Bespoke research trial now!
S&P 500 Quickview Chartbook – 6/30/17
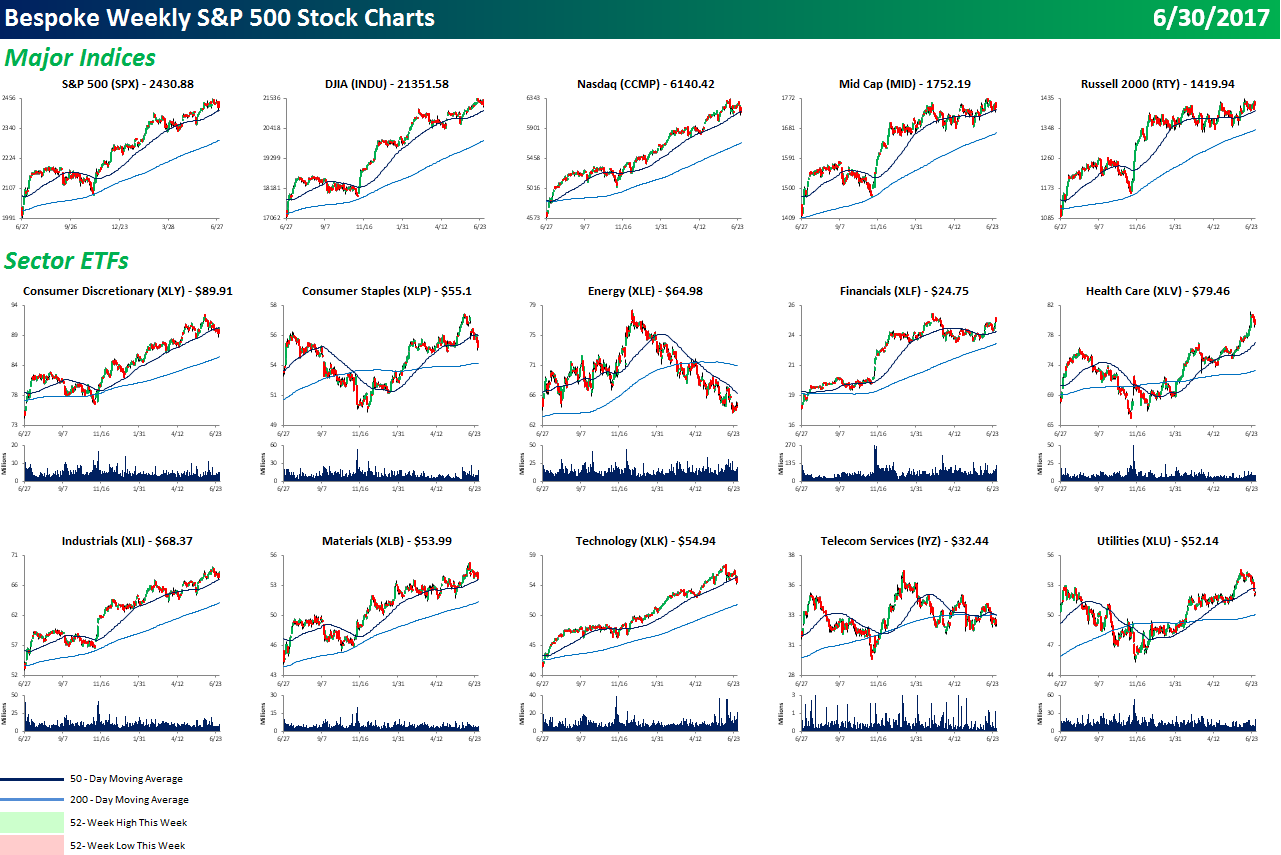
Each weekend as part of our Bespoke Premium and Institutional research service, clients receive our S&P 500 Quick-View Chart Book, which includes one-year price charts of every stock in the S&P 500. You can literally scan through this report in a matter of minutes or hours, but either way, you will come out ahead knowing which stocks, or groups of stocks, are leading and lagging the market. The report is a great resource for both traders and investors alike. Below, we show the front page of this week’s report which contains price charts of the major averages and ten major sectors.
To see this week’s entire S&P 500 Chart Book, sign up for a 14-day free trial to our Bespoke Premium research service.
ETF Trends: Hedge – 6/30/17
Steel continues its strong performance among the universe of ETFs that we track, up 6% on a 5 day rolling basis. Oil is making a nice recovery after appearing on our list of worst performers last week. Energy is also up almost 5%, most likely due to President Trump announcing his plan to achieve “energy dominance” in the coming years. On the losing side, Real Estate and Mining continue to struggle, while Biotech took a step backwards after good performance last week.

Bespoke provides Bespoke Premium and Bespoke Institutional members with a daily ETF Trends report that highlights proprietary trend and timing scores for more than 200 widely followed ETFs across all asset classes. If you’re an ETF investor, this daily report is perfect. Sign up below to access today’s ETF Trends report.
See Bespoke’s full daily ETF Trends report by starting a no-obligation free trial to our premium research. Click here to sign up with just your name and email address.
Bespoke CNBC Appearance (6/29/17)
Bespoke co-founder Paul Hickey appeared on CNBC’s Closing Bell with Kelly Evans, Mike Santoli, and Stephanie Link on 6/29 to discuss the market sell-off and the set up for the second half. To view the segment, please click on the image below.

July 4th Week Returns: Fireworks or a Flop?
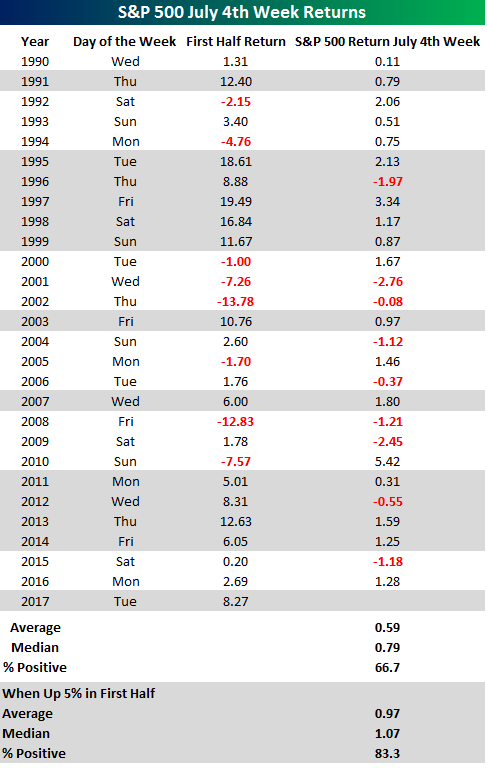
With July 4th coming around next Tuesday, we wanted to provide an update on market returns during the July 4th holiday week. Can we expect fireworks or a flop? The table below lists the S&P 500’s returns during the week of July 4th going back to 1990. For each year, we calculated the S&P 500’s return from the Friday before July 4th to the Friday after, and in those years where the 4th fell on a Friday, we calculated the return from the Friday before (6/27) through the Thursday before (7/3). As shown in the results, July 4th week has been a positive one for equity markets with the S&P 500 averaging a gain of 0.59% (median: +0.79%) and positive returns two-thirds of the time. The best July 4th week actually came back in 2010 when the S&P 500 was up over 5%. What was interesting about that week is that the strong performance came even as economic data during the week was skewed towards the negative side. Also, on the prior Friday, a well-known market strategist made a headline-grabbing call to sell stocks due to the worsening outlook for the US economy.
Given the S&P 500’s strong first half returns in 2017, we also looked at how the market performed in July 4th weeks that followed a strong first half. In the twelve prior years where the S&P 500 was up more than 5% in the first half of the year, July 4th week saw an average gain of 0.97% (median: 1.07%) with positive returns in all but two instances.
Want to see more analysis like this? Click here to start a no-obligation two-week free trial to our premium research platform.
The Closer — Nasty-daq, Twisted VIX, Growth Revised — 6/29/17
Log-in here if you’re a member with access to the Closer.
Looking for deeper insight on global markets and economics? In tonight’s Closer sent to Bespoke Institutional clients, we take a look at the technical picture for tech after big downdrafts today for large cap names in that sector. We also review today’s 3rd release of GDP for Q1.
The Closer is one of our most popular reports, and you can sign up for a free trial below to see it!
The Closer is one of our most popular reports, and you can see it and everything else Bespoke publishes by starting a no-obligation 14-day free trial to our research!
Bespoke’s Sector Snapshot — 6/29/17
We’ve just released our weekly Sector Snapshot report (see a sample here) for Bespoke Premium and Bespoke Institutional members. Please log-in here to view the report if you’re already a member. If you’re not yet a subscriber and would like to see the report, please start a 14-day trial to Bespoke Premium now.
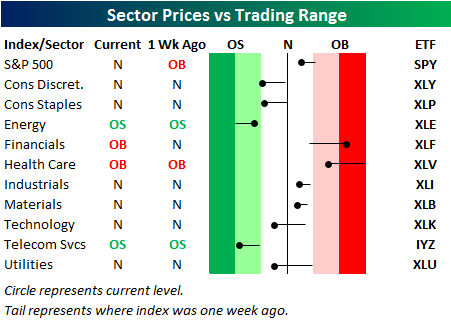
Below is one of the many charts included in this week’s Sector Snapshot, which highlights our trading range screen for the S&P 500 and ten sectors. For each sector, the dot represents where it’s currently trading, while the tail end represents where it was trading one week ago. The black vertical “N” line represents each sector’s 50-day moving average, and moves into the red or green zones are considered overbought or oversold.
As you can see, the S&P 500 has moved from overbought territory to neutral territory over the last week, and it has been led lower by Technology, Consumer Discretionary, Consumer Staples, and Utilities.
To see our full Sector Snapshot with additional commentary plus six pages of charts that include analysis of valuations, breadth, technicals, and relative strength, start a 14-day free trial to our Bespoke Premium package now. Here’s a breakdown of the products you’ll receive.
the Bespoke 50 — 6/29/17
Every Thursday, Bespoke publishes its “Bespoke 50” list of top growth stocks in the Russell 3,000. Our “Bespoke 50” portfolio is made up of the 50 stocks that fit a proprietary growth screen that we created a number of years ago. Since inception in early 2012, the “Bespoke 50” has beaten the S&P 500 by 45.0 percentage points. Through today, the “Bespoke 50” is up 120.1% since inception versus the S&P 500’s gain of 75.1%. Always remember, though, that past performance is no guarantee of future returns.
To view our “Bespoke 50” list of top growth stocks, sign up for Bespoke Premium ($99/month) at this checkout page and get your first month free. This is a great deal!
