B.I.G. Tips – The Most Loved and Hated Stocks
ETF Trends: Hedge – 6/8/17
Gold and biotech continue to outperform with Mexico, AUDUSD, and banks also doing well. Oil and gas has lagged performance-wise for quite a while, and is continuing its run of extremely soft performance, while retail, insurance, and a few country ETFs are also well behind in the universe of ETFs we track.

Bespoke provides Bespoke Premium and Bespoke Institutional members with a daily ETF Trends report that highlights proprietary trend and timing scores for more than 200 widely followed ETFs across all asset classes. If you’re an ETF investor, this daily report is perfect. Sign up below to access today’s ETF Trends report.
See Bespoke’s full daily ETF Trends report by starting a no-obligation free trial to our premium research. Click here to sign up with just your name and email address.
Even Financials Are Getting Some Love Today
No, there’s no need to go restarting your machine or thinking your phone screen in broken, the Financials really are up over 1% today, and the S&P 500 Financial sector is having its best day since late April. What’s rather encouraging about today’s move for the Financials is that the downtrend that has been in place for the sector since the highs earlier this year appears to have been broken. Now if you’re screen is also showing green next to any Energy sector names, we would advise making an appointment at the genius bar!
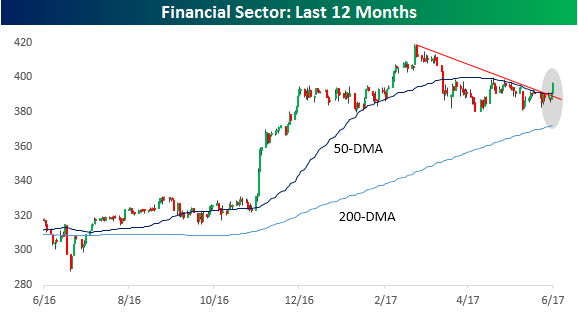
In terms of stocks driving today’s move in the Financial sector, some of the biggest winners today have been the biggest losers since the sector peaked on 3/1. The top part of the table below shows stocks in the sector that were down more than 5% between 3/1 and yesterday but are up 3%+ today. The biggest winners are all banks with Regions (RF) and Citizens Financial (CFG) both up over 3.9%. The only major brokerage firm to make the list is Morgan Stanley (MS) which has erased a good portion of it 7.5% decline with a 3.1% gain today. On the downside, just three stocks in the Financial sector are down today and they are all stocks that were up from 3/1 through 6/7. More broadly, of the 17 stocks in the Financial sector that were up from 3/1 through 6/7, the average gain today is just 0.77%. Conversely, of the 48 stocks that were down from 3/1 through 6/7, the average gain today is over 2%.

Bespoke’s Sector Snapshot — 6/8/17
We’ve just released our weekly Sector Snapshot report (see a sample here) for Bespoke Premium and Bespoke Institutional members. Please log-in here to view the report if you’re already a member. If you’re not yet a subscriber and would like to see the report, please start a 14-day trial to Bespoke Premium now.
Below is one of the many charts included in this week’s Sector Snapshot, which is our sector trading range screen highlighting where the eleven S&P 500 sectors are currently trading in relation to their 50-day moving averages (black vertical “N” lines). As shown, 9 of 11 sectors are trading above their 50-days, and all 9 of those sectors are currently “overbought.” The Financial sector has had an impressive move higher over the last week.
To see our full Sector Snapshot with additional commentary plus six pages of charts that include analysis of valuations, breadth, technicals, and relative strength, start a 14-day free trial to our Bespoke Premium package now. Here’s a breakdown of the products you’ll receive.
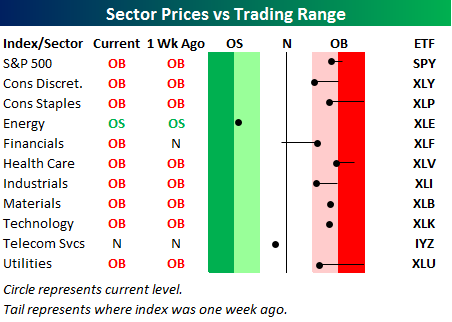
Chart of the Day: Bigger Isn’t Always Better, Wireless Edition
Google Search Trends Report — June 2017
Our “Google Search Trends” report is part of our Pulse add-on service. Google Trends (try it yourself here) allows you to track Internet search interest over time for any search term. For products, services, retailers and other consumer-related entities, this provides enormous insight into historical and current interest. Consumers search for products they’re interested in purchasing, airline tickets they’re looking to book, and stores and restaurants they want to visit. In this report we provide Google Trends search interest charts for every company, website or product that’s covered in our monthly Pulse survey. While search trends alone don’t form a full thesis, we think it can certainly be an input.
Below is an example search trends chart for Amazon. As you can see, Amazon continues to make new highs in search year-in and year-out, with no signs of slowing down. This past holiday season we saw search for “Amazon” hit its highest levels ever.

If you’d like to see these results for dozens of other consumer-related stocks and products, start a 30-day Pulse add-on trial below.
Bespoke Consumer Pulse Add-On — Monthly $39 (with 30-day free trial)
Bespoke Consumer Pulse Add-On — Annual $365 (with 30-day free trial)
the Bespoke 50 — 6/8/17
Every Thursday, Bespoke publishes its “Bespoke 50” list of top growth stocks in the Russell 3,000. Our “Bespoke 50” portfolio is made up of the 50 stocks that fit a proprietary growth screen that we created a number of years ago. Since inception in early 2012, the “Bespoke 50” has beaten the S&P 500 by 47.2 percentage points. Through today, the “Bespoke 50” is up 124.0% since inception versus the S&P 500’s gain of 76.8%. Always remember, though, that past performance is no guarantee of future returns.
To view our “Bespoke 50” list of top growth stocks, sign up for Bespoke Premium ($99/month) at this checkout page and get your first month free. This is a great deal!

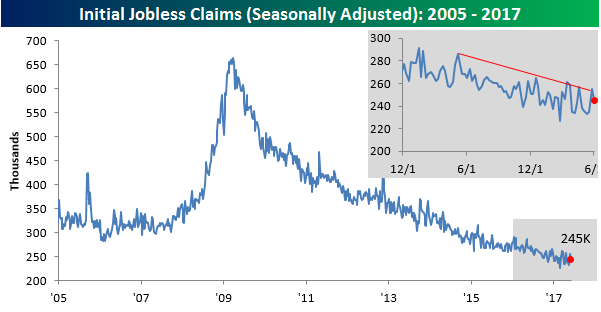
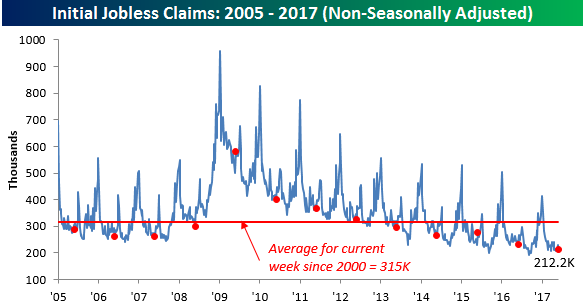
Jobless Claims Disappoint Again
After four straight weeks where jobless claims came in lower than forecast, we have now seen two straight weeks where jobless claims have disappointed to the upside. Last week, claims came in 10K ahead of forecasts and today’s report showed claims coming in 5K higher than expected. While economists were forecasting claims to fall back down to 240K, the actual reading came in at 245K, which was down 10K from last week’s reading of 255K. Despite the higher than expected reading, claims have now been below 300K for 118 straight weeks.
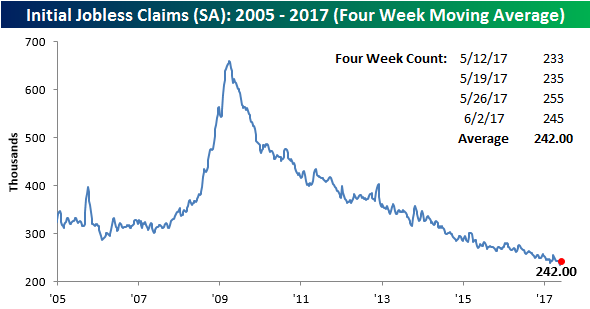
Heading into last week’s report, we were expecting the four-week moving average to make a new cycle low, but the higher than expected reading quashed that plan, and with this week’s reading of 245K, it is unlikely that we will see a new low in claims anytime soon. To get there, the four-week moving average would need to drop down to 235.5K from the current level of 242K. That doesn’t sound like a lot, but in the next two week’s we will be dropping readings in the low 230K range, so the four-week moving average is likely to drift higher.
On a non-seasonally adjusted (NSA) basis, claims fell from 231.6K down to 212.2K. For the current week of the year, this is more than 100K below the average going back to 2000 and the lowest for this specific week since 1974.
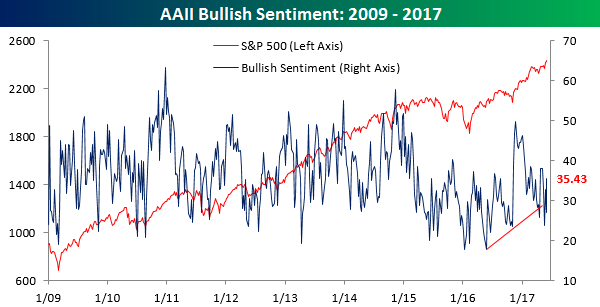
Bullish Sentiment Back on the Upswing
With everything seemingly okay in the equity world again after the major averages all hit new highs to close out last week, individual investors turned more bullish in the latest week. According to the monthly survey from AAII, bullish sentiment increased from a very depressed level of 26.92% up to a five week high of 35.43%. While it’s a far ways from a majority (a level we haven’t seen now in a record 127 straight weeks), this is the first time bulls have been in the plurality in five weeks.
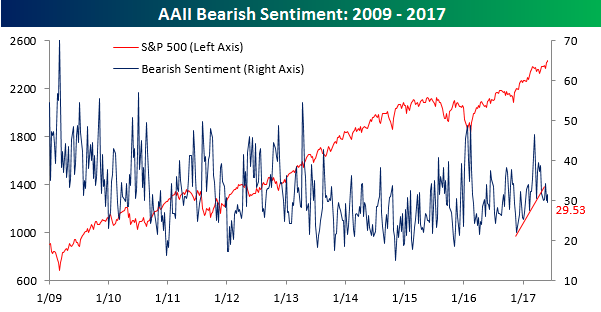
Although bullish sentiment increased, bearish sentiment only saw a modest decline. As shown in the chart below, negative sentiment declined by just two percentage points but did manage to fall back below 30%. Also, that uptrend that had been in place since the lows in late 2015 appears to have been broken.
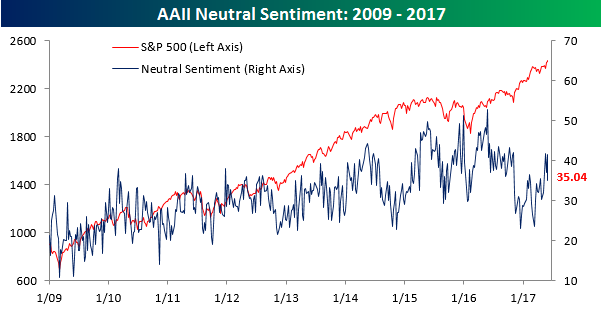
With bullish sentiment on the rise and bearish sentiment barely budging, the neutral camp really shrunk this week falling from above 40% down to 35%.
The Closer — Crude Crumpled — 6/7/17
Log-in here if you’re a member with access to the Closer.
Looking for deeper insight on global markets and economics? In tonight’s Closer sent to Bespoke Institutional clients, we take a look at the EIA’s weekly petroleum market report.

The Closer is one of our most popular reports, and you can sign up for a free trial below to see it!
The Closer is one of our most popular reports, and you can see it and everything else Bespoke publishes by starting a no-obligation 14-day free trial to our research!