Mega-Tech Market Caps Take a Hit
The S&P 500 finished the day slightly lower last Friday, but we saw massive underlying rotation out of large-cap Tech and into other sectors.
Even though the S&P finished in the red on the day, the average stock in the index was up 0.48%. Also, there were 333 advancers on the day versus just 169 decliners.
This is what happens when the largest stocks in a cap-weighted index underperform. All year, it’s been the “mega-Tech” stocks in the S&P that have driven the index higher. But that trade came undone in a big way on Friday.
As shown below, the five largest stocks (AAPL, GOOGL, MSFT, AMZN, FB) in the S&P fell sharply on Friday, and they combined to lose $97.42 billion in market cap. The rest of the stocks in the S&P 500 gained $74.37 billion in market cap.

The chart below shows the change in market cap last Friday by sector. As shown, the overall index lost $23 billion in market cap, but that was nearly all due to losses in Tech. Technology sector stocks lost a combined $142 billion in market cap. The money that came out of Tech shifted right into sectors like Financials, Energy, Health Care, Industrials, Materials, Telecom, and Real Estate. All of these sectors saw inflows, with Financials gaining the most at +$59.8 billion. Energy saw the second biggest gain in market cap at $31.2 billion.

Bespoke Brunch Reads: 6/11/17
Welcome to Bespoke Brunch Reads — a linkfest of the favorite things we read over the past week. The links are mostly market related, but there are some other interesting subjects covered as well. We hope you enjoy the food for thought as a supplement to the research we provide you during the week.
Federal Debt
Twitter investor says US government is bad at managing its finances by Alexandra Scaggs (FTAV)
A brilliant debunking of the deeply problematic attitude that the US government deficit is effectively an income statement. If you read one thing this weekend, make it this. [Link; registration required]
U.S. readying ‘plans and backup plans’ if debt ceiling isn’t raised soon, Mnuchin says by Damian Paletta (WaPo)
A reminder that the debt ceiling will likely be hit by the end of the summer and that the US Treasury is being forced to check for coins under the couch cushions, rather than issue debt for which the markets have ample appetite. [Link]
Trump
The Media Have Been Played by Trump’s Tweets by Bill Murray (Real Clear Politics)
Murray argues that the media is responsible for Trump because they cover his tweets. [Link]
Under Trump, regulation slows to a crawl by Danny Vinik (Politico)
While the lack of new regulations published under the Trump Administration is likely to win cheers from conservatives, it means that the White House is doing very little to alter the course of policy; doing so would require changes to regulations that already exist. [Link]
UK Update
How May’s Sure Thing Became a Political Disaster for the Ages by Tim Ross, Svenja O’Donnell and Alex Morales (Bloomberg)
A brutal tick-tock of the Conservative party reaction to their painful election result Thursday in the UK, which saw their majority in Parliament evaporate in the midst of Brexit negotiations. [Link; auto-playing video]
How Britain Voted by Gregor Aisch, Matthew Bloch, Kenan Davis, Stephen Farrell, Troy Griggs, Rich Harris, and Adam Pearce (NYT)
Less of a read and more of a graphic run-down of the changes in voter preference in the UK this week, with rundowns of the swings in key constituencies, the national swing to Labour, big youth turnout, and a return to dominant position for the two largest parties. [Link]
Britain fears labor shortage as EU workers stay away by Stephen Beard (Marketplace)
With Article 50 triggered and Brexit negotiations underway, the UK’s effort to stem migration via Brexit looks to be creating collateral economic damage already as employers are unable to find workers in several industries. [Link]
All About Amazon
Amazon Introduces Discounted Monthly Prime Offer for Customers Receiving Government Assistance (Amazon)
In an interesting move this week, Amazon has started to segment its Prime customer base by offering consumers receiving government assistance programs (such as SNAP, often referred to as ‘food stamps’) discounted membership. The move speaks to extremely high market penetration among high income consumers and the company’s relentless pursuit to open new markets. [Link]
Some of Amazon’s own brands are becoming super popular online by Jason Del Rey (Recode)
The most popular batteries purchased online, the third-most purchased baby wipe, and a litany of other basic products are all part of Amazon’s private label AmazonBasics. [Link]
Modern Life
Apple is going to let podcast creators — and advertisers — see what listeners actually like by Peter Kafka (Recode)
Up until now, publishers were unable to see how their listeners interacted with podcasts on Apple’s app. Now, that’s changing, creating both opportunity and risk for advertiser-dependent podcasts. [Link]
What are memes — and how do they get kids in trouble? by Elizabeth Weise and Diana Kruzman (USA Today)
A useful background on the evolution of memes, visual in-jokes that communicate ideas quickly and efficiently among digital native young people. [Link]
Your Twitter Outrage May Require Libel Insurance by Polly Mosendz (Bloomberg)
An increasingly popular feature of “umbrella” insurance coverage includes protections against being sued for libel, a risk that had previously only been something journalists were regularly exposed to. [Link]
Long Reads
The Queen Bee of Downtown Durham by Iza Wojciechowska (Bitter Southerner)
Urban beekeeping may seem like a fever dream hatched in the bowels of a Silicon Valley plot line, but the deployment of more than one hundred hives across the Research Triangle Park area by Bee Downtown is a testament to the value of honey pots in cities. [Link]
Take a Look: An Oral History of Reading Rainbow by Jake Rossen (Mental Floss)
A look inside the origins of a fantastic piece of Americana, the PBS program which helped keep kids engaged with books during the summer months. [Link]
The opioid crisis changed how doctors think about pain by Sarah Kliff (Vox)
A deep dive into the sources of the drug epidemic ravaging whole swathes of the country, where pain was swept away with a literal sea of prescription drugs which have now created a huge demand for opioids found in street drugs too. [Link]
He’s heating up, he’s on fire! Klay Thompson and the truth about the hot hand by Tom Haberstroh (ESPN)
An investigation of the folk lore, statistics, and impact of the hot hand in sports, especially professional basketball. [Link]
Musk
Elon Musk: The Man, the Myth, the Risk by Charley Grant (WSJ)
A cogent rundown of the reasoning behind Tesla’s investors, who have completely foregone income statements and balance sheets in pursuit of a far grander vision. [Link; paywall]
Scaffolding
The law that created the billion-dollar scaffold industry has turned city sidewalks into an obstacle course by Aaron Elstein (Crain’s New York)
Ever wonder why New York City sidewalks are so often framed by metal scaffolding? The explanation is a wave of laws designed to prevent building materials from striking pedestrians. [Link]
The Economy
Anxious About the Economy? It’ll Still Set a Record by Tim Duy (Bloomberg)
There’s ample reason to suspect that while the current economic expansion will inevitably end in recession, that kind of pullback in activity is still a long way off. [Link]
Retirement
Retirees flock to Latin America to live an upper-class lifestyle on $1,500 a month by Jim Wyss (The Charlotte Observer/Miami Herald)
The Social Security Administration sends checks to around 380,000 seniors living abroad, up about 50% over the last decade, as US retirees seek lower cost of living in a variety of countries across Latin America. [Link]
Have a great Sunday!
The Closer 6/9/17 – End of Week Charts
Looking for deeper insight on global markets and economics? In tonight’s Closer sent to Bespoke clients, we recap weekly price action in major asset classes, update economic surprise index data for major economies, chart the weekly Commitment of Traders report from the CFTC, and provide our normal nightly update on ETF performance, volume and price movers, and the Bespoke Market Timing Model. This week, we’ve added a section that helps break down momentum in developed market foreign exchange crosses.

The Closer is one of our most popular reports, and you can sign up for a free trial below to see it!
Click here to start your no-obligation two-week free Bespoke research trial now!
ETF Trends: US Sectors & Groups – 6/9/17
Banks have bounced, big time, breaking out of a painful string of underperformance. Small caps, Mexico, and even Energy have started to move up. Despite rallies in energy equities over the past week, oil ETFs that hold futures have not done well, lagging badly. The Nasdaq’s brutal Friday put it near the bottom performance-wise, while the UK, Europe, and EM are lagging too.

Bespoke provides Bespoke Premium and Bespoke Institutional members with a daily ETF Trends report that highlights proprietary trend and timing scores for more than 200 widely followed ETFs across all asset classes. If you’re an ETF investor, this daily report is perfect. Sign up below to access today’s ETF Trends report.
See Bespoke’s full daily ETF Trends report by starting a no-obligation free trial to our premium research. Click here to sign up with just your name and email address.
The Bespoke Report – 6/9/17 – Lots of Light, Less Heat
Below is an excerpt from our weekly Bespoke Report, just sent to subscribers.
- Both sides of the Atlantic were abuzz this week with political headlines: a former FBI director took the stand in Washington to call the President a liar, while a shocking election result in the UK sent the pound sterling tumbling and threw the entire country into political flux while the ticking clock of Article 50 is running.
- For all that political heat, XIV (the inverse short-term VIX futures ETF) has outperformed SPY by almost 50% YTD (chart, right).
- The VIX has been below 16 for 145 straight closes through Thursday, the third-longest such streak on record, and hit its lowest levels since 2006 on Friday.
- An equal-weighted portfolio that should perform well in a “good policy” environment (short ten year notes, long the dollar, and long equities) has moved sideways almost all year long.
- In other words, despite a raucous period for society, the markets are tame and docile.
- That’s a scenario we’ve been mulling for quite some time; the reaction from global equity markets following Brexit was an early sign of that regime, as was the equity market’s significant rally in 2016 following the US election.
- Back in March, we highlighted the steady grind higher in the stock market during the tumultuous year of 1964, when Goldwater ran for President, the Civil Rights Act became law, Vietnam was heating up, and LBJ introduced his ’Great Society’ initiatives.
- In the background of the light from political disruption is the economy: after the entire world got onto the same page of upside surprises in Q1, American data has deteriorated.
- Investors are forced to ask: is the political light distracting from weak data here in the USA?
If you’d like to read our thoughts on recent performance plus the rest of this week’s Bespoke Report newsletter, take advantage of our one-month Bespoke Premium free trial offer. Sign up now at this page.
Have a great weekend!

How Does the Current Rally Stack Up?
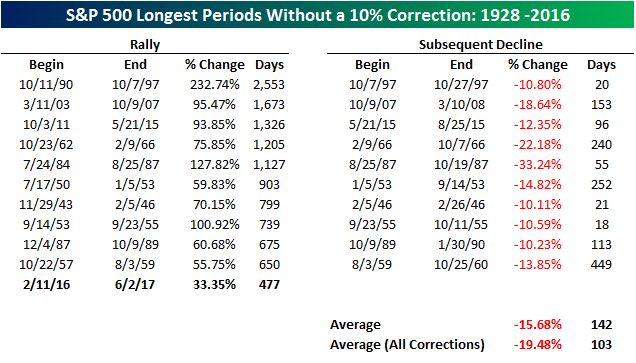
Ever since last February’s “Dimon Bottom” where JP Morgan CEO Jamie Dimon’s purchase of stock in his bank has come to symbolize the low of the late 2015/early 2016 market sell-off, US equities have been on a practically uninterrupted run higher. While there have been bumps along the way, the S&P 500 hasn’t seen a 10% correction at any time in the last 16 months, rallying more than 33%. With the current rally lasting 477 calendar days, it ranks as the eleventh longest run in the S&P 500 without a 10% correction since 1928. In the table below, we list each of the ten longest rallies without a correction as well as how much the S&P 500 declined in the following correction.
If the current rally is going to crack the top ten, it has a lot of work to do on the upside. At 477 days, the S&P 500 would need to go another 173 days before reaching a short-term peak. That would take the current run past Thanksgiving! Another thing to note is that just as the ten prior rallies lasted much longer, they were also considerably stronger. In fact, the average and median gain during the ten prior rallies that went longer without a correction was more than 90%! Looking ahead, you would think that the harder they run, the harder they fall. In actuality, though, the average decline in the correction that followed the ten prior rallies was a decline of 15.7% over 142 days. Compared to all corrections since 1928 where the average decline was 19.5%, these corrections may have lasted longer but their intensity was not as strong.
Finally, how overdue are we for a correction? Since 1928, there have been 95 10%+ corrections for the S&P 500. While corrections tend to come at irregular intervals, that works out to about one every eleven months. That would make the S&P 500 currently about six months overdue for a correction.
S&P 500 Quick View Chart Book: 6/9/17
Each weekend as part of our Bespoke Premium and Institutional research service, clients receive our S&P 500 Quick-View Chart Book, which includes one-year price charts of every stock in the S&P 500. You can literally scan through this report in a matter of minutes or hours, but either way, you will come out ahead knowing which stocks, or groups of stocks, are leading and lagging the market. The report is a great resource for both traders and investors alike. Below, we show the front page of this week’s report which contains price charts of the major averages and ten major sectors.
To see this week’s entire S&P 500 Chart Book, sign up for a 14-day free trial to our Bespoke Premium research service.
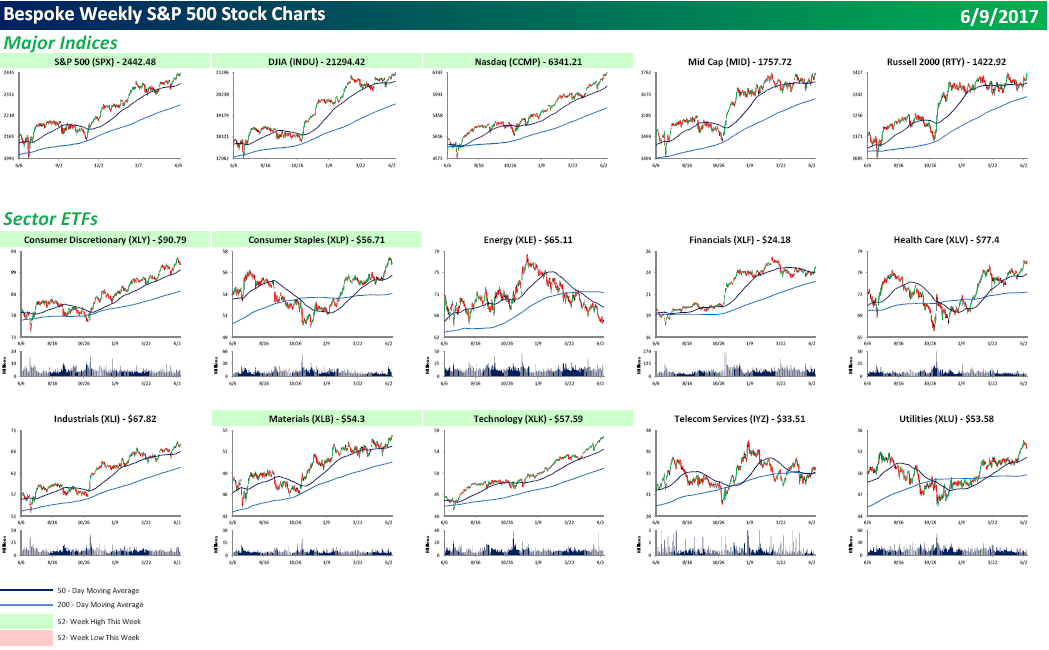
Chart of the Day – Will the Second Half See a Pickup in the Frequency of 1% Days?
B.I.G. Tips – Simultaneous Declines in the Dollar and Crude
Here’s one you don’t see often. While commodities like crude oil and the dollar usually move in the opposite direction, ever since the end of 2016 they have been practically joined at the hip. Year to date, the US Dollar Index has declined by over 5% while crude oil is down more than 15%. Going back to 1983, the current simultaneous decline in both the dollar and oil is one of only 13 times where both have declined more than 5% over a 100-trading day period.
In a B.I.G. Tips report just published, we looked back at prior periods with similar simultaneous declines to see how the dollar, crude oil, and equities in general traded following each period. For anyone interested in seeing the results of this interesting study, sign up for a monthly Bespoke Premium membership now!
The Closer — Debt & Policy: Super Thursday Summarized — 6/8/17
Log-in here if you’re a member with access to the Closer.
Looking for deeper insight on global markets and economics? In tonight’s Closer sent to Bespoke Institutional clients, we recap Super Thursday: early returns from the UK election, a very brief recap of Comey testimony and what it may mean for the market, and the Fed’s quarterly flow of funds report. Today the Bank of Canada released its biannual financial stability report, which we summarize as well. We also introduce a “US policy portfolio” designed to track how the market views the outlook for policy.
The Closer is one of our most popular reports, and you can sign up for a free trial below to see it!
The Closer is one of our most popular reports, and you can see it and everything else Bespoke publishes by starting a no-obligation 14-day free trial to our research!