ETF Trends: Hedge – 6/16/17
Antipodean equities have been the best performers in the world in USD terms over the past week. The bond rally following weak CPI earlier this week has put EDV, TLT, and IYR near the top of the list as well, while a surprise flip to hawkish language from BoC officials has boosted CAD. Industrials and EM have also performed well. Less strong performances came from metals and mining, steelmakers, and the food and beverage sector. The latter was hit hard today by the news that Amazon is buying Whole Foods for more than $13 billion, scaring the market on the potential for competition in the grocery sector.

Bespoke provides Bespoke Premium and Bespoke Institutional members with a daily ETF Trends report that highlights proprietary trend and timing scores for more than 200 widely followed ETFs across all asset classes. If you’re an ETF investor, this daily report is perfect. Sign up below to access today’s ETF Trends report.
See Bespoke’s full daily ETF Trends report by starting a no-obligation free trial to our premium research. Click here to sign up with just your name and email address.
Permits and Housing Starts Disappoint Big Time
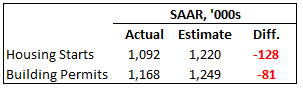
It has been a really tough month for housing data. Over the last month, virtually every housing related indicator including Existing Home Sales, New Home Sales, Homebuilder Sentiment, Pending Home Sales, and now Housing Starts and Building Permits have missed consensus estimates. Not only did Friday’s Housing Starts and Building Permits miss forecasts, but they did so in a big way. As shown below, Housing Starts missed forecasts by 128K which was tied for the third biggest miss relative to expectations of the current expansion and the tenth largest in the last 20 years. Building Permits were nearly as weak relative to expectations as the 81K miss was the fourth largest miss relative to expectations of the expansion and the tenth largest miss relative to expectations since 2002.
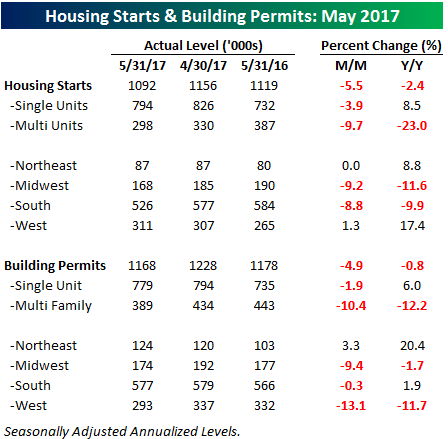
The table below breaks down this month’s Housing Starts and Building Permits reports by the size of unit and region. In the case of both Starts and Permits, the weakness in May was driven primarily by a big slowdown in multi-family units, although single-family units were also down, just not by nearly as much on a m/m basis. On a y/y basis, single-family starts and permits are both up while multi-family units are down by double-digit percentages.
The first two charts below show overall Housing Starts and Building Permits since 2005. In both cases, current levels are down over 14% from their cycle peaks, but the chart of Building Permits looks a lot more to be in the process of rolling over than Housing Starts.
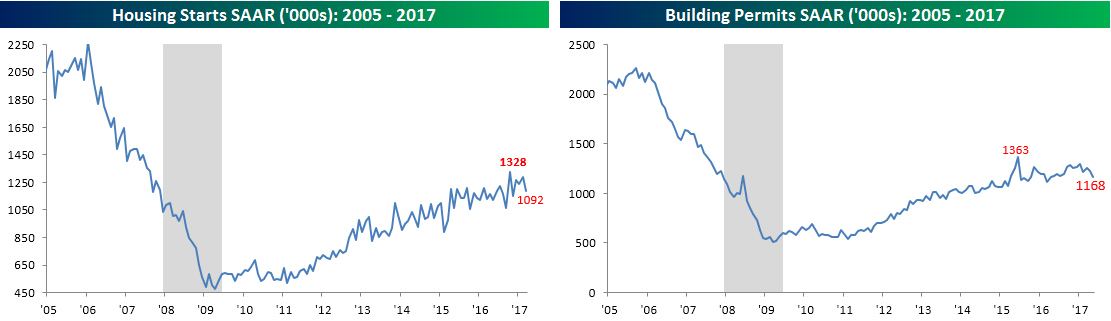
On a single-family basis, current levels of starts and permits are not down nearly as much as the headline readings. In both cases, May’s readings are down by less than 7% and aren’t quite showing signs of rolling over yet.
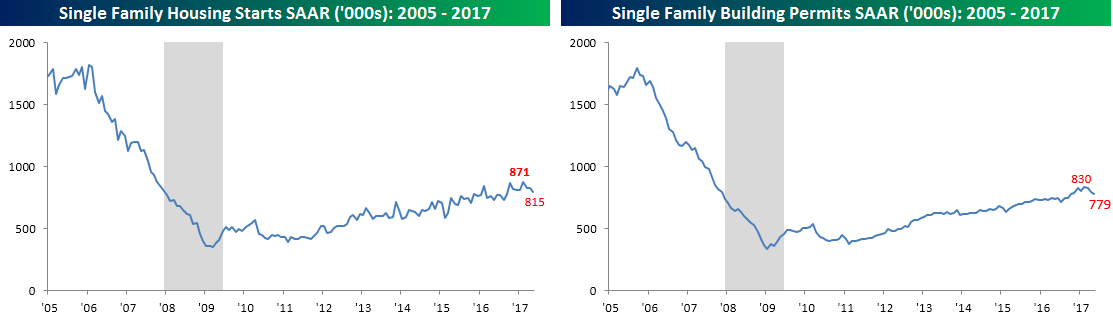
Multi-family units, however, are another (ugly) story. These readings have completely rolled over in the last several months and are down by over 40% from their cycle highs and not far from new lows since those peaks.
The Closer — 4 US Releases, BoJ Ahead — 6/15/17
Log-in here if you’re a member with access to the Closer.
Looking for deeper insight on global markets and economics? In tonight’s Closer sent to Bespoke Institutional clients, we recap US economic data released this morning, and review the overall stance of BoJ policy ahead of that central bank meeting tonight.

The Closer is one of our most popular reports, and you can sign up for a free trial below to see it!
The Closer is one of our most popular reports, and you can see it and everything else Bespoke publishes by starting a no-obligation 14-day free trial to our research!
Bespoke’s Sector Snapshot — 6/15/17
We’ve just released our weekly Sector Snapshot report (see a sample here) for Bespoke Premium and Bespoke Institutional members. Please log-in here to view the report if you’re already a member. If you’re not yet a subscriber and would like to see the report, please start a 14-day trial to Bespoke Premium now.
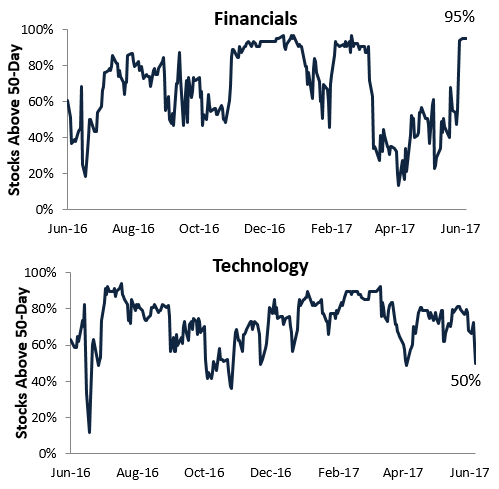
Below are two of the many charts included in this week’s Sector Snapshot, which highlights underlying breadth for the S&P 500 Financials and Technology sectors. As shown, breadth for Tech has weakened quite a bit recently, with just 50% of stocks now trading above their 50-days. Breadth for Financials, however, has been surging, and 95% of the sector’s members are now above their 50-days.
To see our full Sector Snapshot with additional commentary plus six pages of charts that include analysis of valuations, breadth, technicals, and relative strength, start a 14-day free trial to our Bespoke Premium package now. Here’s a breakdown of the products you’ll receive.
Homebuilders Join the List
In the eight-plus years that this bull market has spanned, the number of “I never thought I’d see that again” moments has continued to pile up. One of the first important ones was back in 2010 when the S&P 500 approached the “pre-Lehman’ levels of 1,250. The psychological boost from trading back to that level couldn’t be understated as it signaled a return to normalcy in the market. We first approached the pre-Lehman levels back in April 2010, but then markets pulled back on one of the seemingly annual bed-wettings over Greece, so we had to wait another eight months until December of the same year before actually getting over the hump.
Another big notch in the belt of the bull came in the Spring of 2013 when the S&P 500 notched a new all-time high, surpassing the previous peak from October 2007. After all the scars of New Century Financial right through to Wachovia, Merrill, Lehman, and AIG, the market was finally able to put the past behind it and move forward to a new frontier. Back at those lows in late 2008/early 2009, when people were literally taking money out of the bank out of fears that they may not open tomorrow, there was no one who would have ever thought that US stocks would be at new all-time highs early on in the second term of President Obama. Two years later, the Nasdaq also made a new all-time high, hitting levels not seen in over 15 years.
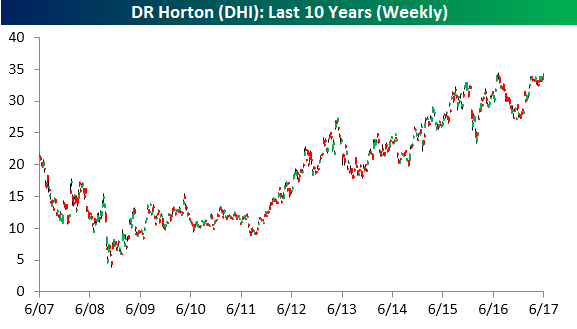
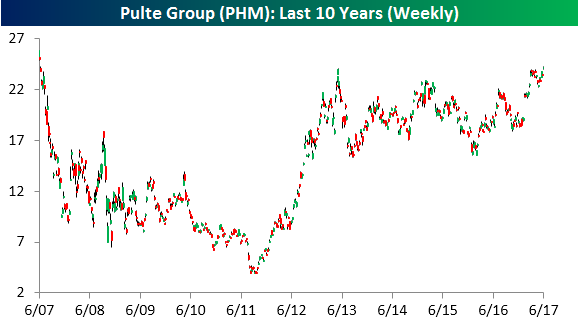
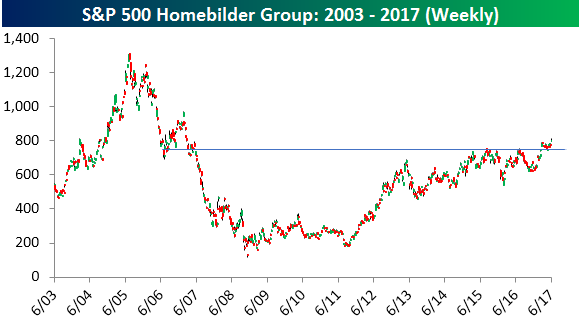
This week, it was the homebuilders’ turn. While the highs from 2005 are still a ways from here, the stocks of homebuilders all broke out to ten-year highs yesterday. That’s a phrase that hasn’t been uttered in more than ten years! And they did it in unison. All three stocks that make up the S&P 500 Homebuilder group – DR Horton (DHI), Lennar (LEN), and Pulte (PHM) – traded at decade highs Wednesday.

Truth be told, there is still more for the homebuilders to do before all-time highs are actually made. To get back to levels seen at the Summer 2005 peak, the homebuilders still need to rally more than 60%. However, the fact that these stocks were able to rally in what has recently been slowing housing data has been impressive. In fact, the latest releases of Building Permits, Existing Home Sales, New Home Sales, Homebuilder Sentiment, and Pending Home Sales have all come in weaker than expected. When it comes to the recent trading of the homebuilders, are they trying to tell us something or just plain oblivious?
B.I.G. Tips – Nasdaq 100 on the Cusp
The Nasdaq 100 came close to breaking below its 50-day moving average this morning, but in afternoon trading things have bounced back a bit. In the charts below, you’ll see that the Nasdaq 100 has been above its 50-day moving average for all of 2017 so far; the last time the index closed below its 50-day was on December 6th, 2016 — 131 trading days ago. If the index manages to close above its 50-day once again today, the current 131-trading day streak will be the third longest in the index’s history. As shown in the second chart below, there have only been 7 prior streaks of 100 trading days or more.
In a B.I.G. Tips report just sent to paid research clients, we analyze how the Nasdaq 100 typically performs in the days and weeks after a streak like the current one comes to an end. To find out whether a 50-DMA break is a bearish signal or not, start a 14-day free trial to our Bespoke Premium package now. You’ll receive a 20% off lifetime discount along with the 14-day free trial if you use this checkout link. Here’s a breakdown of the products you’ll receive.


Homebuilder Sentiment Takes a Dip in the Summer Heat
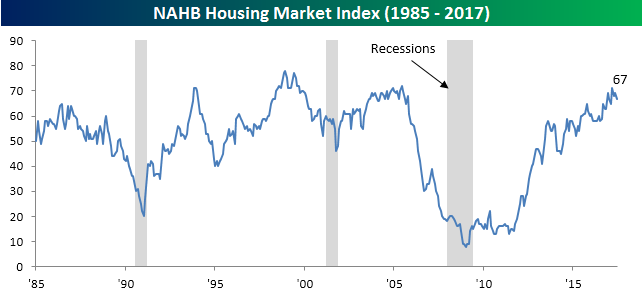
As temperatures across the country and homebuilder stocks move higher, homebuilder sentiment saw a nationwide dip in June. According to the NAHB, homebuilder sentiment dipped two points falling from a revised down reading of 69 last month to a level of 67. The June reading was also three points below consensus forecasts for a reading of 70. The chart of homebuilder sentiment these days looks a lot like other indicators as it is off its recent highs, but still right near the top of its range for the cycle.
The table below shows how sentiment breaks down in terms of Present and Future Sales, Traffic, and regions. In terms of the national reading of sales and traffic, they all saw equal declines this month falling by two points. On a regional basis, sentiment saw varied moves. In the West, sentiment was down a whopping nine points, which was the largest one-month decline for that region since January. The South and Northeast regions saw much more modest declines, while the Midwest actually saw a jump in sentiment. The regional breakdown of sentiment is interesting in that sentiment readings in the Midwest, South and West are all closely bunched, but then you have the Northeast out there all by itself in the mid-40s.

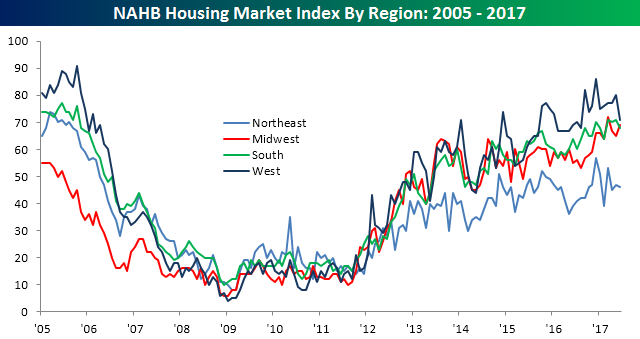
Chart of the Day: Defensive Rotation Post-Hike – What Comes Next?
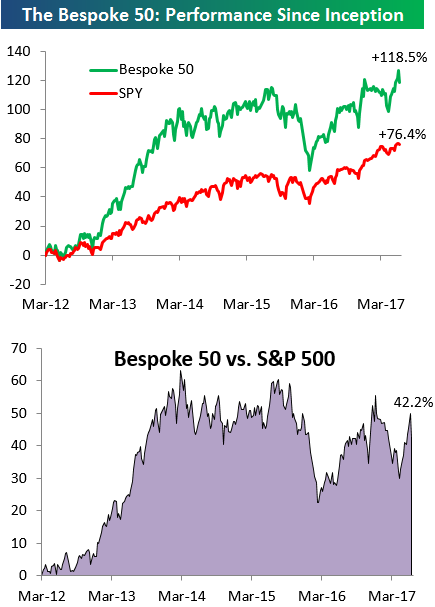
the Bespoke 50 — 6/15/17
Every Thursday, Bespoke publishes its “Bespoke 50” list of top growth stocks in the Russell 3,000. Our “Bespoke 50” portfolio is made up of the 50 stocks that fit a proprietary growth screen that we created a number of years ago. Since inception in early 2012, the “Bespoke 50” has beaten the S&P 500 by 42.2 percentage points. Through today, the “Bespoke 50” is up 118.5% since inception versus the S&P 500’s gain of 76.4%. Always remember, though, that past performance is no guarantee of future returns.
To view our “Bespoke 50” list of top growth stocks, sign up for Bespoke Premium ($99/month) at this checkout page and get your first month free. This is a great deal!
Philly Fed and Empire Manufacturing Converge
After last month’s prints where the Empire Manufacturing and Philly Fed reports moved in separate directions, the June reports for both surveys converged with each other. Let’s start with the Empire Manufacturing report. In May’s report, the headline index dropped to negative territory for the first time since October, but in June it rebounded in a big way, rising to a level of 19.8 compared to expectations for a reading of 5.0. So how does that stack up? Relative to expectations, it was the biggest beat since October 2009. On its own, it was the best reading since September 2014, and in terms of m/m increases, it was the 2nd largest jump in the history of the survey (since 2001) trailing only May 2003. That’s pretty impressive!
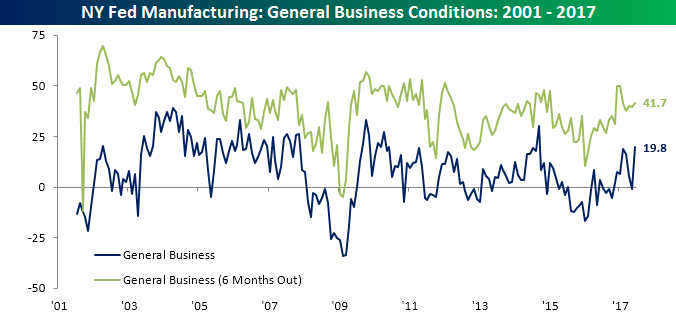
Looking at the internals of the report, breadth was generally positive with nine components increasing and just three declining. Areas of strength came in New Orders and Shipments, while Number of Employees, Delivery Times, and Prices Paid were the only decliners. While current conditions in the Empire Manufacturing report were positive, expectations were a bit more subdued as every component except New Orders declined.

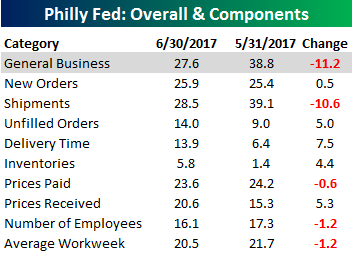
Heading south down to Philadelphia, in last month’s Philly Fed report, general business conditions actually increased, but in this month’s report it edged down from 38.8 to 27.6. That was still good enough to beat consensus expectations of 24.9 and is much closer to the highs rather than the lows of the cycle.

As far as the internals of the Philly Fed were concerned, along with General Business conditions, respondents saw a sizable decline in Shipments and just minor declines in the Number of Employees and Average Workweek. This month’s Philly Fed report also asked respondents how they expect production in Q2 to compare to Q1. 60.3% or respondents see production increasing, with more than half citing improved business conditions, while just 17.2% expect production to decline and only a small percentage of them cited business conditions as the reason for production declines. All in all, conditions in the Philadelphia region remain positive.