Economic Data Surprisingly Negative
US economic data has been coming in drastically below economists’ estimates of late. Last week we noted that the string of weak readings has been extra painful for housing, with a truly weak residential construction report and a slower than expected homebuilder confidence reading. It hasn’t been all bad news for US data of course; the Atlanta Fed is currently tracking 2.9% GDP in Q2, while the St. Louis Fed model sees 2.32% and the NY Fed is tracking 1.86%. With trend growth around 2%, none of those are terrible. Relative to estimates, however, the data has been much weaker.
As shown below, the Citi Economic Surprise Index, which measures the pace at which indicators are beating estimates, has hit its lowest levels since the summer of 2011, when the economy hit an air pocket at the same time Washington debated raising the debt ceiling and created unnecessary uncertainty (eventually leading to a downgrade from S&P). While recent activity hasn’t been terrible, it’s extremely underwhelming due to the high expectations of economists. That doesn’t mean the economy is crashing; instead, economists will likely cut estimates, data will be stable or possibly tick up a bit, and suddenly the surprise index will rebound. To illustrate the process, below we’ve charted the Citi Economic surprise index and a good old fashioned sin function (remember those from middle school trigonometry?). You can’t use a sin function to predict when or how high the Citi Economic surprise index will bounce, but they are both cyclical, rising and falling back and forth over time. With economic surprises currently coming in worse than all but 5 prior periods of weak data in the history of the Citi index, it’s likely that chastened economists will start underestimating economic performance soon, at least at the margin, restarting the whole cycle to the upside.
Bespoke Stock Seasonality – 6/19/17
Chart of the Day – Whole Foods Friday
Dow 30 Trading Range Screen — 6/19/17 Update
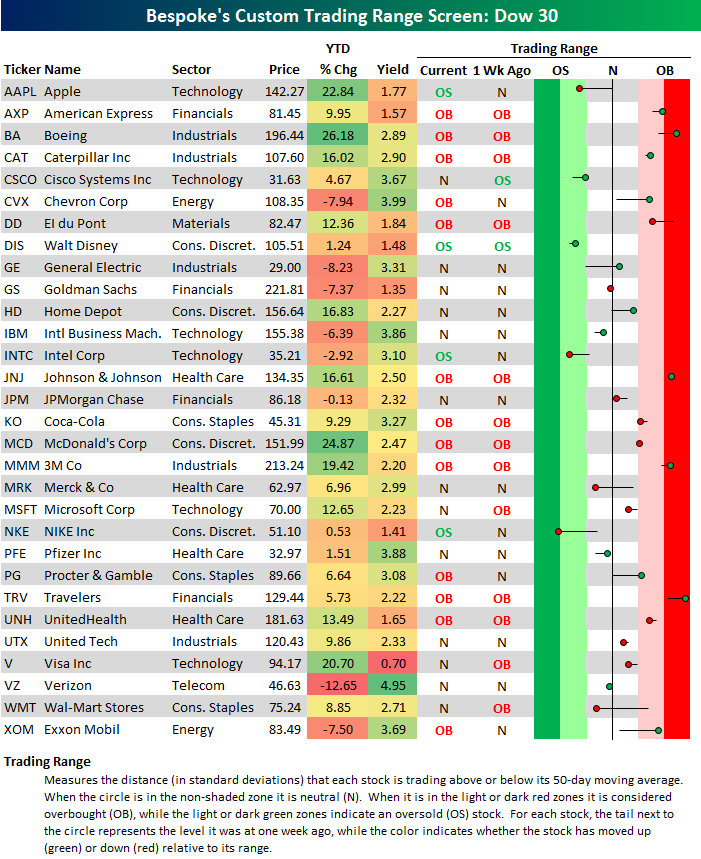
Below is an updated look at our Dow 30 trading range screen. For each stock, the dot represents where it is currently trading within its range, while the tail end represents where it was trading one week ago. The black vertical “N” line represents each stock’s 50-day moving average, and moves into the red or green zones are considered overbought or oversold.
Due to some pretty significant sector rotation that we’ve seen over the last couple of weeks, the 30 members of the Dow are pretty scattered right now. In a “rising tide lifts all boats” type of market, you’ll see the entire Dow moving higher in unison. That’s not the case right now as some stocks in the index are overbought, some are neutral, and some are oversold.
Of the 13 overbought stocks, Boeing (BA), Johnson & Johnson (JNJ), 3M (MMM), and Travelers (TRV) are at the most extreme levels. Of the 4 oversold stocks, Nike (NKE) is the most beaten down. Disney (DIS), Intel (INTC), and Apple (AAPL) are the remaining oversold names.
A couple of weeks ago, Apple (AAPL) was the best performing stock in the Dow on a year-to-date basis, but declines have left it up just 22.84% YTD coming into today. Boeing (BA) is now the best Dow stock so far in 2017 with a gain of 26.18%.
On the downside, Verizon (VZ) is the deepest in the red with a YTD decline of 12.65%. General Electric (GE), Chevron (CVX), Exxon (XOM), and Goldman Sachs (GS) are also solidly in the red.
Mean Reversion Trade
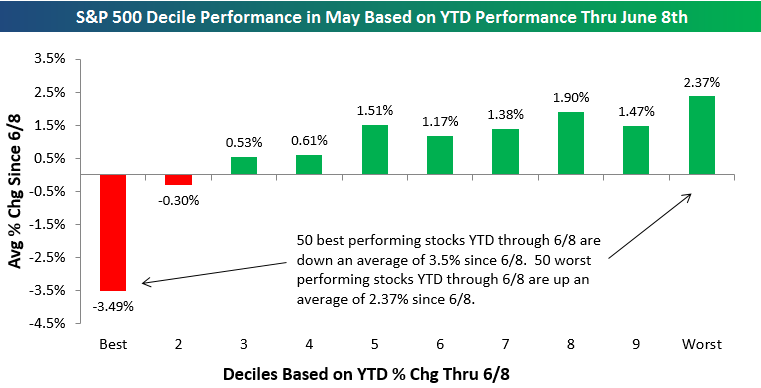
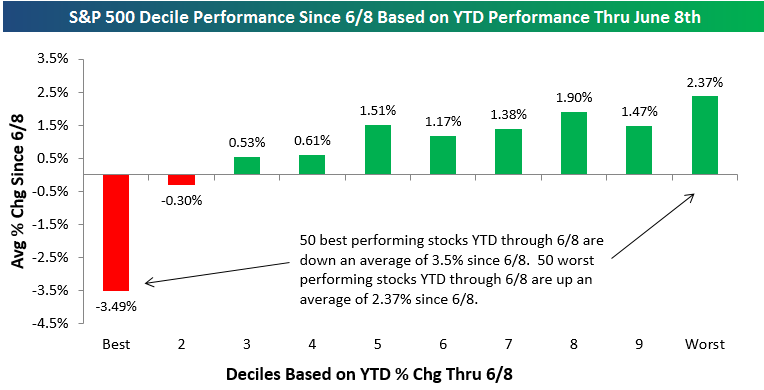
Since the close on June 8th, we’ve seen the tech-heavy Nasdaq sell-off from all-time highs by a few percentage points. But while it might seem like this pullback in Tech has dragged the rest of the market down with it, the average stock in the S&P 500 is actually up 70 basis points since June 8th. In reality, what we’ve seen since the 8th is a “mean reversion” trade. We can see this with our decile analysis of the S&P 500 below.
We’ve broken the S&P 500 into deciles (10 groups of 50 stocks each) based on year-to-date stock performance through the close on 6/8. Decile 1 contains the 50 best-performing stocks YTD through 6/8, decile 2 contains the next best 50, and so on and so forth until you get to decile 10, which contains the 50 worst performing stocks YTD through 6/8.
In the chart below, we highlight the average performance of the stocks in each decile since the close on 6/8. As shown, the 50 stocks that were up the most YTD through 6/8 are down an average of 3.5% since then, while the next best 50 through 6/8 are down an average of 0.30%. The stocks in the remaining 8 deciles have all averaged gains since 6/8, with decile 10 (the worst stocks YTD) seeing the biggest average gain at +2.37%.
Bespoke Brunch Reads: 6/18/17
Welcome to Bespoke Brunch Reads — a linkfest of the favorite things we read over the past week. The links are mostly market related, but there are some other interesting subjects covered as well. We hope you enjoy the food for thought as a supplement to the research we provide you during the week.
Old Stuff New Ways
Goldman Set Out to Automate IPOs and It Has Come Far, Really Fast by Dakin Campbell (Bloomberg)
Inside the mammoth effort to standardize and digitize the process of launching a company into public markets. [Link]
Tim Cook Says Apple Focused on Autonomous Systems in Cars Push by Alex Webb and Emily Chang (Bloomberg)
Apple is now publicly discussing the secretive project it’s had running for years to develop an autonomous car. [Link, auto-playing video]
New Iron-Aluminum Alloy Is Strong and Light as Titanium, 10% of the Cost by Jamie Condilffe (Gizmodo)
South Korea’s Pohang University and POSCO are partnering to spin up a production line for an extremely light but strong alloy that would come in much cheaper than titanium or carbon fiber, the current high bars in materials. [Link]
Clean Energy
Wind, solar surpassed 10 percent of U.S. electricity in March: EIA by Valerie Volcovici (Reuters)
New monthly data from the EIA showed remarkable progress in renewables’ penetration of US market share; most impressive was the 37% of power generated in Iowa coming from either wind or solar. [Link]
Solar Power Will Kill Coal Faster Than You Think by Jess Shankleman and Hayley Warren (Bloomberg)
A new annual forecast from Bloomberg energy finance estimates coal costs to move above those of solar in 2021 for China, already around the same costs in Germany and the US. [Link, auto-playing video]
World Coal Production Just Had Its Biggest Drop on Record by Rakteem Katakey (Bloomberg)
In 2016 total global coal output dropped by over 200mm oil equivalent tons in 2016, with demand down 1.7% globally and declines on every continent except Africa according to BP’s annual world energy review. [Link, auto-playing video]
Dystopia
American Health Care Tragedies Are Taking Over Crowdfunding by Suzanne Woolley (Bloomberg)
With proposed legislation projected to throw tens of millions of Americans out of the ranks of the insured, crowd funding sites could become the locus of efforts to prevent medical care from bankrupting its recipients. [Link, auto-playing video]
Rigged by Brett Murphy (USA Today)
A review of the debt servitude that truck drivers serving the ports of LA and Long Beach enter into when they start moving goods off ships and towards American consumers. [Link]
Code of Silence by Rebecca Wexler (Washington Monthly)
If an algorithm was deciding your fate, you’d probably want to know how it worked, but for prisoners in many states that’s not in the cards. [Link]
Monetary Policy
Why I Dissented Again by Neel Kashkari (Medium)
America’s most digitally engaged FOMC member is at it again, with a post explaining why he dissented against the most recent FOMC hike. [Link]
Demonetisation update 29 – glimpsing the benefits by Anantha Nageswaran (The Gold Standard)
Part of an ongoing series about the demonetization (that is, the declaration that some bank notes were invalid) which is bringing Indian black markets into the formal economy; tax receipt gains are one beneficiary. [Link]
Investing
How to Take a Crazy Risk Without Going Insane by Jason Zweig (WSJ)
A review of how one investor is handling – and thriving – in the volatile bubble markets that are crypto currencies. [Link]
Tudor’s New Event Hedge Fund Gaining 9% Is Bright Spot for Firm by Hema Parmar (Bloomberg)
Weak returns in macro (down 1.2% YTD through the start of June) are being offset by strong returns in the event-driven equities strategy Tudor also operates. [Link]
Good Stuff
El Capitan, My El Capitan by Daniel Duane (NYT)
A shocking achievement was recorded recently at El Capitan in the Yosemite Valley, where a climber made it all the way to the top without any rope or rest. [Link, soft paywall]
Prankster Tricks Tech Incubator Into Supporting Homeless People by Matthew Gerring (Broke-Ass Stuart)
A rundown of Pinboard founder Maciej Ceglowski’s run to the top of a Hacker News contest designed to provide VC investment to a startup, which Ceglowski handed directly to a homeless shelter instead. [Link]
Bad Stuff
Pakistani man sentenced to death for posting ‘blasphemy’ on Facebook by Colin Lecher (The Verge)
A man in Pakistan will be killed by the state for making “negative remarks” about religious figures, including the prophet Mohammed. [Link]
Mastermind of Lottery Fraud Will Tell How He Rigged Jackpots by Ryan J. Foley and Todd Richmond (Bloomberg/AP)
A former lottery computer programmer and his former judge brother face jail time after defrauding the Multi-State Lottery Association of $3mm. [Link]
NAFTA
U.S. Exports to Mexico Fall as Uncertainty Over Nafta Lingers by Jacob Bunge (WSJ)
US farmers are having a harder time selling south of the border as less grain and meat moves from the US heartland to its largest export market, all driven by a desire to diversify supply in the face of possible restrictions on trade. [Link, paywall]
Islamic Finance
Islamic finance industry frets as Dana Gas deems its sukuk invalid by Bernardo Vizcaino (Reuters)
Sukuk bonds help companies access financing without violating sharia law, which bans charging interest. Dana Gas, listed in Abu Dhabi, decided this week that $700mm of its bonds are no longer compliant with sharia, and that they won’t be repayed; investors will be offered lower-return alternatives. [Link]
End Of An Era
McDonald’s ends Olympics sponsorship deal early by Liana B. Baker and Karolos Grohmann (Reuters)
After 41 years of sponsorship, the Golden Arches is ending its sponsorship of the Olympic Games, preferring to focus on individual athletes and saving hundreds of millions. [Link]
School
The end of the valedictorian? Schools rethink class rankings by Carolyn Thompson (AP)
American high schools are starting to phase out the final ranking of students, with only half of schools still reporting final class ranks. [Link]
Sports
Jets Launch All New Jets Boarding Pass (NY Jets)
Like heading to stadium and chanting J-E-T-S, but hate sitting in the same seat every time? The Jets have a deal for you. [Link]
Mergers and Amiquistions
Message Startup Slack Draws Interest From Amazon.com by Alex Sherman, Eric Newcomer, and Alex Barinka (Bloomberg)
While Amazon closed the week out by dropping almost $14bn on Whole Foods, earlier in the week all the speculation was over whether the company would be buying Slack. [Link]
Health
2.2 billion people are overweight and sick, but we’re still measuring them by a terrible metric by Sara Chodosh (Popular Science)
Inside the deeply flawed Body Mass Index and the alternative measurements which are more accurate as predictors of health trouble. [Link]
Have a great Sunday!
The Closer 6/16/17 – End of Week Charts
Looking for deeper insight on global markets and economics? In tonight’s Closer sent to Bespoke clients, we recap weekly price action in major asset classes, update economic surprise index data for major economies, chart the weekly Commitment of Traders report from the CFTC, and provide our normal nightly update on ETF performance, volume and price movers, and the Bespoke Market Timing Model. This week, we’ve added a section that helps break down momentum in developed market foreign exchange crosses.

The Closer is one of our most popular reports, and you can sign up for a free trial below to see it!
Click here to start your no-obligation two-week free Bespoke research trial now!
The Bespoke Report — 6/16/17
S&P 500 Quickview Chart Book – 6/16/17
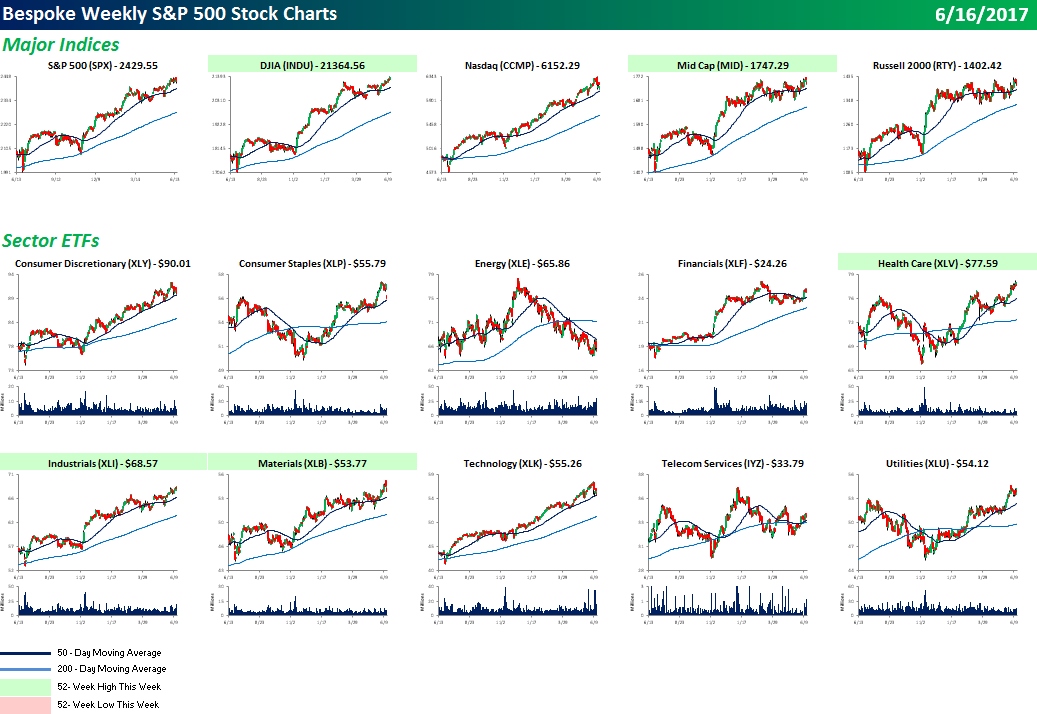
Each weekend as part of our Bespoke Premium and Institutional research service, clients receive our S&P 500 Quick-View Chart Book, which includes one-year price charts of every stock in the S&P 500. You can literally scan through this report in a matter of minutes or hours, but either way, you will come out ahead knowing which stocks, or groups of stocks, are leading and lagging the market. The report is a great resource for both traders and investors alike. Below, we show the front page of this week’s report which contains price charts of the major averages and ten major sectors.
To see this week’s entire S&P 500 Chart Book, sign up for a 14-day free trial to our Bespoke Premium research service.
The Shot Heard Round the Mall
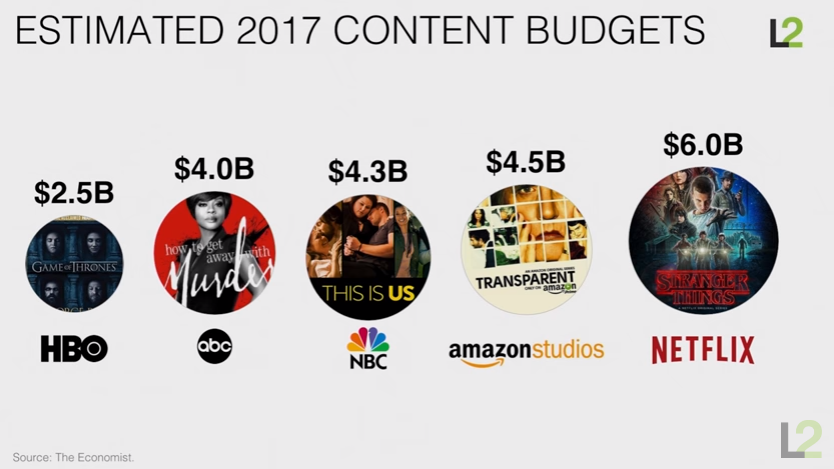
Death By Amazon is a term we coined years ago to describe how Amazon was single-handedly destroying the margins, businesses, and ultimately prospects of traditional retailers as consumers transitioned from bricks to clicks. Like any pandemic, it started out small and with little fanfare in just books, but then Amazon made the jump to electronics, general merchandise, clothing, and just about every other sector in retailing. For many products that seemed un-Amazonable five years ago, Amazon is now the first place people turn. Even in the entertainment space, Amazon is barreling in. The slide below from a presentation Scott Galloway made in April shows that Amazon is forecasted to spend more on content this year than NBC, ABC, or HBO!
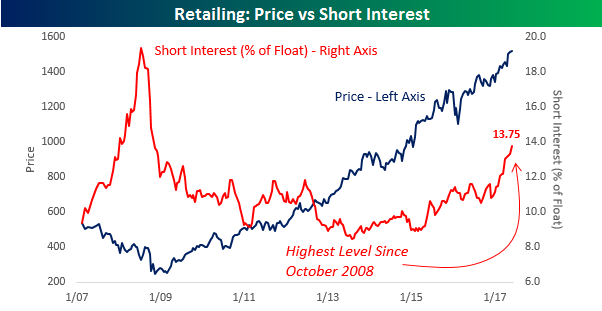
As Amazon infects all things retail, investors are piling in on the short side betting against traditional retailers. In this week’s latest update to short interest data, the average level of short interest in retail stocks (as a percentage of float) reached the highest level it has been since the depths of the last recession. All this is based in large part on fears that Amazon will continue to move into the space of traditional retailers and further marginalize them.
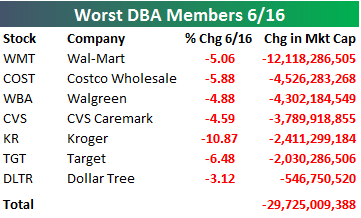
Things got a lot more real this morning when Amazon announced that it was acquiring Whole Foods for just under $14 billion, and a collective “Oh Sh%$!” was uttered in the headquarters of every other retailer across the country. The reaction in their stocks was immediate. For starters, Amazon saw its market cap increase by 3%, which translates almost exactly to what it is paying for Whole Foods. Outside of these two companies, though, they are dropping like flies. Of the 54 companies that make up our Death By Amazon (DBA) Index, the average decline as of Friday morning was nearly 3%, and the destruction in market cap has been significant. Check out the table below. Seven companies that make up our DBA index have lost at least half a billion dollars in market cap today alone. Leading the way lower, Wal-Mart has lost more than $12 billion, or $2 billion more than the entire market cap of Whole Foods before the deal was announced! In total, the seven companies shown have shed nearly $30 billion in market cap. Earlier this month, some started to think it was safe to get back in the water of retail after stories surfaced that the Nordstrom family was looking to take its namesake company private, but Uncle Jeff quickly put the kibosh on that idea today.
Start a two-week free trial to Bespoke’s research platform to read more.