Bespoke’s Asset Class Performance Matrix — 6/23/17
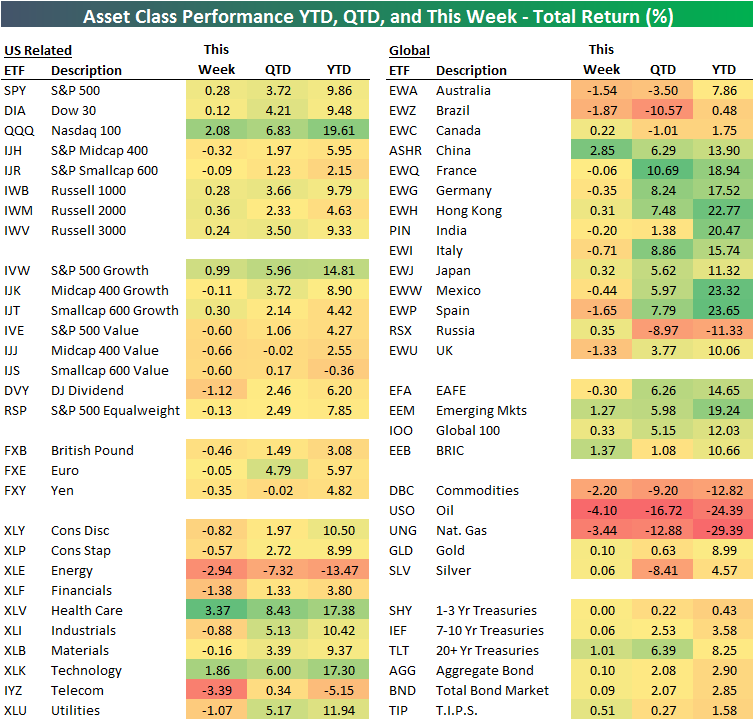
Each week we typically provide an update on asset class performance, and below is a look at how various areas of financial markets have performed recently. In the matrix below, we use ETFs traded on US exchanges to track performance, which we look at on a total return basis over the last week, quarter-to-date, and year-to-date.
After hitting a rough patch in early June, the Tech-heavy Nasdaq 100 (QQQ) was the top performing US index ETF this week. Year-to-date, QQQ is up more (+19.6%) than any other US equity related ETF in our matrix. While QQQ was up 2.09% this week, we saw the S&P Midcap and Smallcap ETFs (IJH and IJR) pull back a bit. The S&P 500 (SPY) and Dow 30 (DIA) are finishing the week just slightly higher.
While the broad market was marginally in the green this week, eight sectors actually declined while just two gained. Telecom (IYZ), Energy (XLE), and Financials (XLF) struggled the most, while Health Care (XLV) and Technology (XLK) are the two sectors that finished higher.
Outside of the US, the Chinese equity market (ASHR) is the only area of the world that saw nice gains this week at +2.85% following the announcement that they will be included in the MSCI EM indices. Brazil (EWZ), Australia (EWA), Spain (EWP), and the UK (EWU) all saw declines of more than 1%.
Energy commodities were deep in the red this week, and they’re deep in the red both QTD and YTD as well. In fixed income, the 20+ Year Treasury ETF (TLT) saw a nice gain of 1.01% this week and is now up 6.39% in Q2.
Start a 14-day free trial to Bespoke’s premium research platform to read our weekly Bespoke Report newsletter.
The Most Extended Stocks in the Russell 1,000
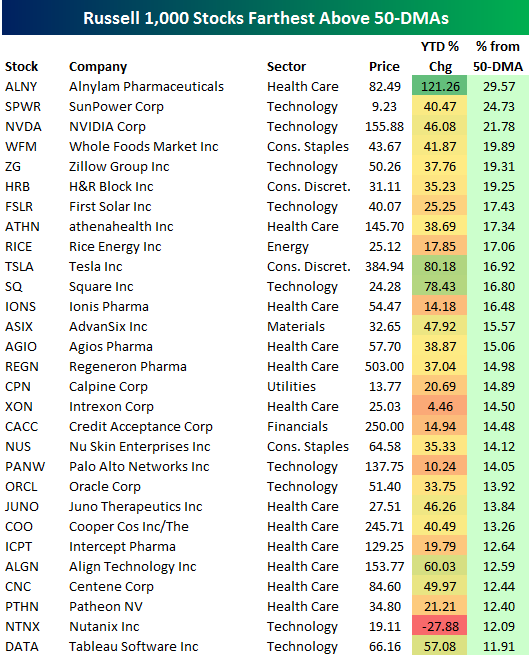
The average stock in the Russell 1,000 is currently 0.80% above its 50-day moving average. That’s healthy because it’s in positive territory, but it’s far from an “overbought” number. As shown in the chart below, however, there’s quite a bit of deviation between sectors. The average Health Care stock is 6.24% above its 50-day (a very high number) while the average Energy stock is 9.31% below its 50-day (a very low number).

For those interested, below is a list of the Russell 1,000 stocks currently trading the farthest above their 50-day moving averages. The list is littered with Technology and Biotech/Health Care stocks. Alnylam Pharma (ALNY) is the farthest above its 50-day at +29.57% (also up 121% YTD), followed by SunPower (SPWR) at 24.73%, and NVIDIA (NVDA) at 21.78%. Whole Foods (WFM) and Zillow rank 4th and 5th. Other notables on the list of most extended stocks include First Solar (FSLR), Tesla (TSLA), Square (SQ), Palo Alto Networks (PANW), Oracle (ORCL), and Tableau Software (DATA).
Check-Up on Bespoke’s “Trump Stock Portfolio”
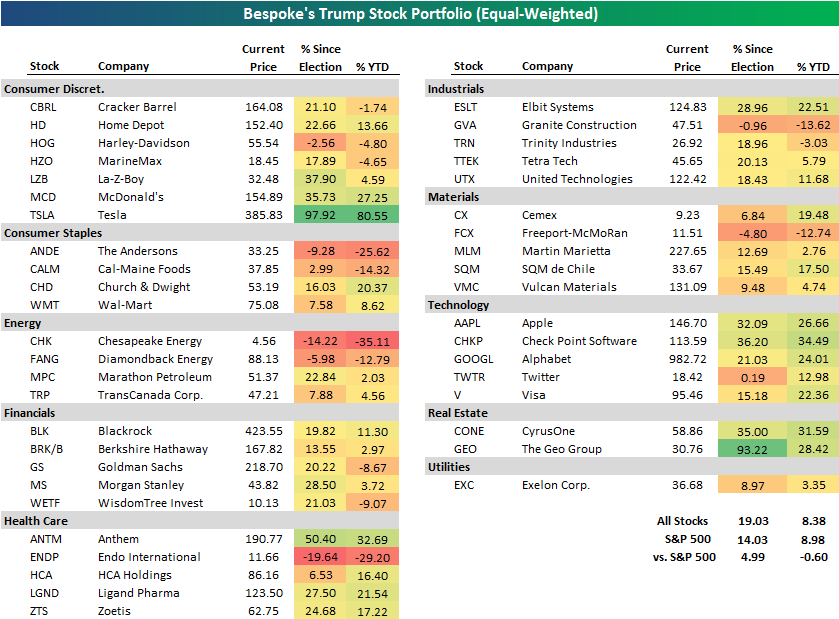
At the end of 2016 we put together a list of stocks that stood to benefit the most from the new “Trump Economy.” With the first half of the year coming to an end next week, our list of stocks is performing nearly exactly in-line with the S&P 500 on a year-to-date basis. We didn’t construct this list as a “Buy” portfolio, but rather as a way for clients to generate ideas based on which of Trump’s proposals they thought had the best chance of actually getting done.
Of the stocks in the Trump Portfolio, it’s the Technology stocks that have done the best this year — AAPL, CHKP, GOOGL, TWTR, and V. Other big winners have been Tesla (TSLA), McDonald’s (MCD), Anthem (ANTM), Elbit Systems (ESLT), Cemex (CX), SQM de Chile (SQM), CyrusOne (CONE), and the Geo Group (GEO). Health Care stocks like HCA, Ligand (LGND), and Zoetis (ZTS) have all done well too.
The biggest losers have been names like the Andersons (ANDE), Cal-Maine (CALM), Chesapeake (CHK), Diamondback (FANG), Endo (ENDP), Granite Construction (GVA), and Freeport (FCX).
We’ll check back in to see how performance looks at the end of the third quarter in September.
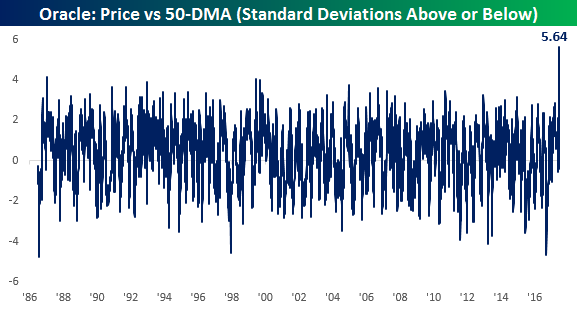
Oracle’s Most Overbought Close Ever
Who said Tech was dead? While concerns towards the Technology sector have increased following the late afternoon swoon in tech stocks two weeks ago, shares of Oracle surged over 8% on Thursday following a strong earnings report after the close on Wednesday. That rally in reaction to earnings was the stock’s best earnings reaction day since March 2009 and the fourth biggest one-day gain following earnings since the dot-com crash. With Thursday’s rally, shares of ORCL also traded to all-time highs well above the levels it reached during the 2000 bubble.
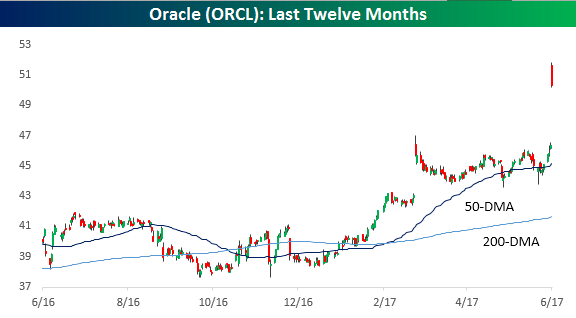
Just as impressive as ORCL’s performance yesterday, the stock also traded at the most extreme short-term overbought level it has traded in its history. ORCL closed 5.6 standard deviations above its 50-day moving average yesterday, which exceeded its previous most extreme levels by a mile. When looking at stocks relative to their 50-day moving averages, three standard deviations typically counts as pretty stretched. Occurrences where a stock trades four standard deviations above its 50-day don’t come by very often, but five is practically unheard of! Now, just because a stock reaches extreme overbought or oversold levels doesn’t mean it has to reverse course. Instead, it just serves as an indication of how far the stock’s current price has deviated from its typical range. In the case of ORCL, what also sticks out is the fact that less than a year ago, the stock traded at its most oversold level since just after its IPO in 1986.
The Closer — Banxico Dovish Hike, Canadian Retail Roundup — 6/22/17
Log-in here if you’re a member with access to the Closer.
Looking for deeper insight on global markets and economics? In tonight’s Closer sent to Bespoke Institutional clients, we recap the Banxico’s decision to hike interest rates to 7% today, break down Canadian retail sales and update our GDP tracking model, and discuss two minor data points from the US today.

The Closer is one of our most popular reports, and you can sign up for a free trial below to see it!
The Closer is one of our most popular reports, and you can see it and everything else Bespoke publishes by starting a no-obligation 14-day free trial to our research!
Bespoke’s Sector Snapshot — 6/22/17
We’ve just released our weekly Sector Snapshot report (see a sample here) for Bespoke Premium and Bespoke Institutional members. Please log-in here to view the report if you’re already a member. If you’re not yet a subscriber and would like to see the report, please start a 14-day trial to Bespoke Premium now.
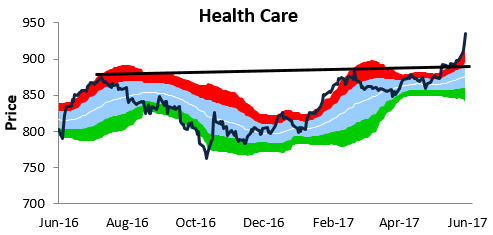
Below is one of the many charts included in this week’s Sector Snapshot, which highlights our trading range chart for the S&P 500 Health Care sector. The red zone in the chart is considered “overbought” territory, and as you can see, the Health Care sector has blown out to extreme overbought levels this week.
To see our full Sector Snapshot with additional commentary plus six pages of charts that include analysis of valuations, breadth, technicals, and relative strength, start a 14-day free trial to our Bespoke Premium package now. Here’s a breakdown of the products you’ll receive.
the Bespoke 50 — 6/22/17
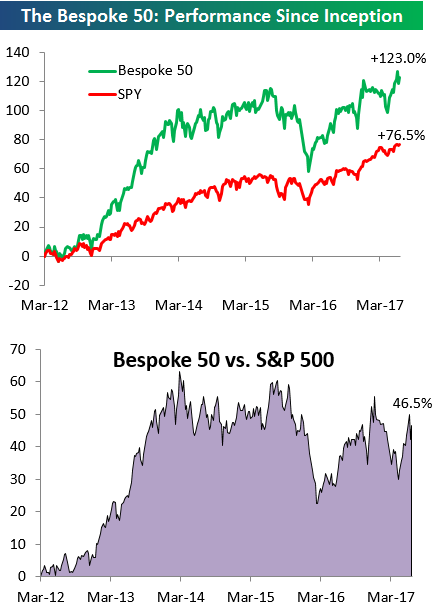
Every Thursday, Bespoke publishes its “Bespoke 50” list of top growth stocks in the Russell 3,000. Our “Bespoke 50” portfolio is made up of the 50 stocks that fit a proprietary growth screen that we created a number of years ago. Since inception in early 2012, the “Bespoke 50” has beaten the S&P 500 by 46.5 percentage points. Through today, the “Bespoke 50” is up 123% since inception versus the S&P 500’s gain of 76.5%. Always remember, though, that past performance is no guarantee of future returns.
To view our “Bespoke 50” list of top growth stocks, sign up for Bespoke Premium ($99/month) at this checkout page and get your first month free. This is a great deal!
ETF Trends: US Indices & Styles – 6/22/17
Biotech continues to outperform on a trailing 5 day basis versus the universe of ETFs we track. Today, the release of the Senate’s version of repeal for the ACA is helping push healh care higher, and biotech is receving some of the benefit along with Pharma stocks and Health Care more broadly. Chinese ETFs have risen, as while bonds continue to outperform as well. On the losing side of the slate, retail, banking, and commodities are undeperformers along with a smattering of EM equity ETFs.

Bespoke provides Bespoke Premium and Bespoke Institutional members with a daily ETF Trends report that highlights proprietary trend and timing scores for more than 200 widely followed ETFs across all asset classes. If you’re an ETF investor, this daily report is perfect. Sign up below to access today’s ETF Trends report.
See Bespoke’s full daily ETF Trends report by starting a no-obligation free trial to our premium research. Click here to sign up with just your name and email address.
Tech In Europe Versus The US: Similar Performance, Different Details
Bullish Sentiment Still Depressed
It’s been a pretty uneventful week in the markets, so not surprisingly, bullish sentiment was little changed as well. According to the weekly survey from AAII, bullish sentiment increased from 32.27% up to 32.65%, extending the current record streak of weeks below 50% to 129. More recently, over the last sixteen weeks, there have been only four weeks where more than a third of investors were bullish.
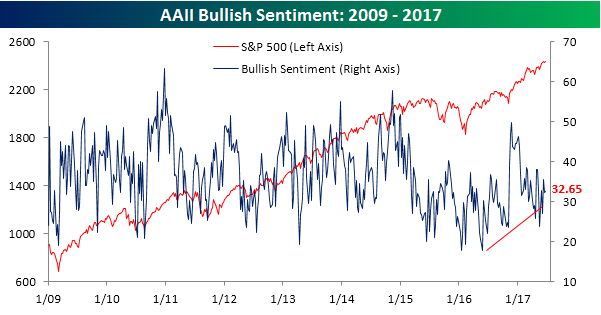
While bulls have been scarce, bears haven’t been running rampant. In this week’s survey, bearish sentiment was pretty much unchanged at 28.91%. Believe it or not, this is the third week where bearish sentiment was below 30%, which is the longest streak of the year. As shown in the chart below, the trend of higher bearish sentiment that began in late 2016 has definitively been broken.
