The Bespoke Report Newsletter – 7/28/17 – Scary…With a Small s
Bespoke’s FAANG+ Trading Range Screen
Below is an updated look at our trading range screen for the 30 largest Nasdaq 100 stocks. We’ve highlighted the “FAANG” stocks in yellow.
Facebook (FB), Charter (CHTR) and Baidu (BIDU) are currently the most overbought names in this group, while Starbucks (SBUX) and Qualcomm (QCOM) are the most oversold.
Apple (AAPL) is currently sitting right on support at its 50-day moving average ahead of earnings next Tuesday.

The Closer: End of Week Charts — 7/28/17
Looking for deeper insight on global markets and economics? In tonight’s Closer sent to Bespoke clients, we recap weekly price action in major asset classes, update economic surprise index data for major economies, chart the weekly Commitment of Traders report from the CFTC, and provide our normal nightly update on ETF performance, volume and price movers, and the Bespoke Market Timing Model. This week, we’ve added a section that helps break down momentum in developed market foreign exchange crosses.

The Closer is one of our most popular reports, and you can sign up for a free trial below to see it!
Click here to start your no-obligation two-week free Bespoke research trial now!
S&P 500 Quick-View Chart Book: 7/28/17
B.I.G. Tips – Earnings Season Summary
Most Important Companies to Watch on Earnings Next Week
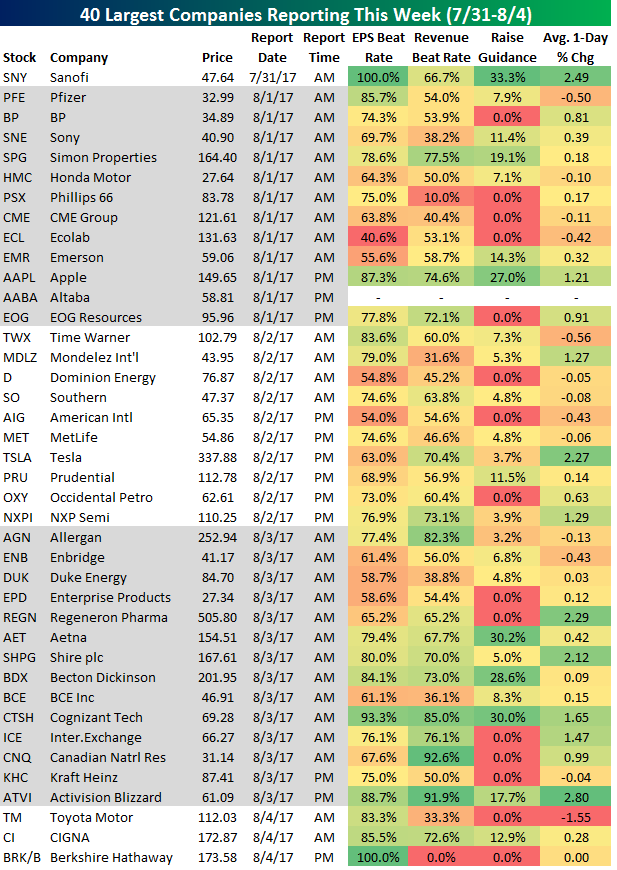
Below is a list of the 40 largest companies set to report earnings this week. Next to each company, we provide its historical beat rates (% of time beating analyst estimates) and its average one-day change on its earnings reaction days.
Sanofi (SNY) kicks things off on Monday morning, and then Apple (AAPL) will get all of the attention on Tuesday after the close. Tesla (TSLA) and Time Warner (TWX) are the two key names to watch on Wednesday, and then there really aren’t any mega-cap companies reporting on Thursday or Friday that will draw a significant amount of coverage.
Of the names shown, Sanofi (SNY), Apple (AAPL), Pfizer (PFE), Cognizant (CTSH), Activision (ATVI), and Berkshire (BRK/B) have historically beaten EPS estimates the most often. In terms of price change on earnings, Sanofi (SNY), Tesla (TSLA), Regeneron (REGN), Shire (SHPG), and Activision (ATVI) have historically averaged the biggest gains on their report days.
ETF Trends: US Indices & Styles – 7/28/17
Oil ETFs saw massive gains this week among the world of ETFs we track daily, with USO and DBO up almost 9% and 7%, respectively. Energy also appears near the top of our list, appearing in the top 10 for the 3rd straight day. Natural Resources and Base Metals round out the list of other notable outperformers. Healthcare providers struggled, most likely a reaction to the Senate’s failure to pass their “skinny bill”. Transports and Pharma also continued their downward trend, down over 2%.

Bespoke provides Bespoke Premium and Bespoke Institutional members with a daily ETF Trends report that highlights proprietary trend and timing scores for more than 200 widely followed ETFs across all asset classes. If you’re an ETF investor, this daily report is perfect. Sign up below to access today’s ETF Trends report.
See Bespoke’s full daily ETF Trends report by starting a no-obligation free trial to our premium research. Click here to sign up with just your name and email address.
The Closer — Data Recap With US GDP Tomorrow — 7/27/17
Log-in here if you’re a member with access to the Closer.
Looking for deeper insight on global markets and economics? In tonight’s Closer sent to Bespoke Institutional clients, we review a big slate of economic data from the US today ahead of advance Q2 GDP tomorrow morning.
The Closer is one of our most popular reports, and you can sign up for a free trial below to see it!
See today’s post-market Closer and everything else Bespoke publishes by starting a no-obligation 14-day free trial to our research platform!
Bespoke’s Sector Snapshot — 7/27/17
We’ve just released our weekly Sector Snapshot report (see a sample here) for Bespoke Premium and Bespoke Institutional members. Please log-in here to view the report if you’re already a member. If you’re not yet a subscriber and would like to see the report, please start a 14-day trial to Bespoke Premium now.
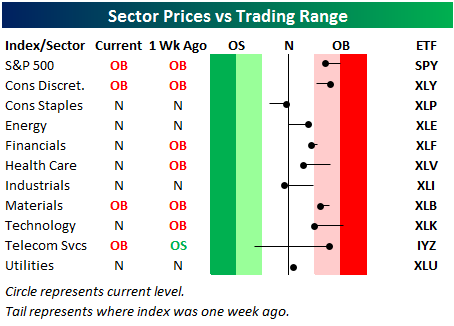
Below is one of the many charts included in this week’s Sector Snapshot, which highlights our trading range screen for the S&P 500 and ten sectors. For each sector, the dot represents where it’s currently trading, while the tail end represents where it was trading one week ago. The black vertical “N” line represents each sector’s 50-day moving average, and moves into the red or green zones are considered overbought or oversold.
The S&P 500 and three of ten sectors are currently overbought, but most sectors are now lower versus where they were a week ago due to today’s sell-off.
To see our full Sector Snapshot with additional commentary plus six pages of charts that include analysis of valuations, breadth, technicals, and relative strength, start a 14-day free trial to our Bespoke Premium package now. Here’s a breakdown of the products you’ll receive.
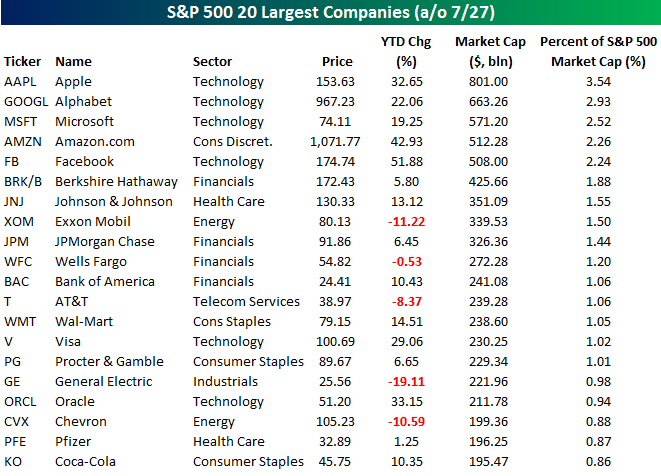
Facebook Joins the Half a Trillion Club
After an initially negative reaction to earnings after the close yesterday, shares of Facebook (FB) staged a sharp rebound overnight and into today and are currently up by over 5%. With that gain, Facebook’s market cap exceeded $500 billion for the first time, joining the narrow ranks of Apple (AAPL), Alphabet (GOOGL), Microsoft (MSFT), and Amazon.com (AMZN). At one point this morning, it looked as though FB would overtake AMZN for the number four spot, but AMZN’s rally today has been enough to hold FB at bay (for now). The table below lists the 20 largest companies in the S&P 500 based on market cap, and as you can plainly see, tech dominates the top of the list with the three largest companies and four of the top five. The only non-tech stock listed is AMZN, and one could easily make the case that it is just as “techy” as any of the other names.
What’s really fascinating about the market caps of these top companies is that the four largest stocks in the S&P 500 Technology sector now account for 48% of the sector’s total market cap and 11% of the entire S&P 500. Looking at it from the other side of the market cap spectrum, the 50 smallest companies in the S&P 500 account for less than 1.5% of the index’s total market cap while the smallest 200 companies account for less than 10% of the index’s market cap. Think about that for a second. If the smallest 200 companies in the S&P 500 were to drop to zero overnight, we still wouldn’t get a 10% correction in the S&P 500!
While there has been a lot of talk about the fact that the S&P 500 has become so top heavy and the risks it poses, by itself it isn’t a problem. As long as the rest of the index continues to hang in there, it is not a problem. The time to be concerned would be if we ran into a situation like 1999/2000 when the top stocks were rallying but the rest of the market was faltering. The best way to track that is by monitoring overall breadth levels, and looking at those, we are from that point.