the Bespoke 50 — 6/29/17
Every Thursday, Bespoke publishes its “Bespoke 50” list of top growth stocks in the Russell 3,000. Our “Bespoke 50” portfolio is made up of the 50 stocks that fit a proprietary growth screen that we created a number of years ago. Since inception in early 2012, the “Bespoke 50” has beaten the S&P 500 by 45.0 percentage points. Through today, the “Bespoke 50” is up 120.1% since inception versus the S&P 500’s gain of 75.1%. Always remember, though, that past performance is no guarantee of future returns.
To view our “Bespoke 50” list of top growth stocks, sign up for Bespoke Premium ($99/month) at this checkout page and get your first month free. This is a great deal!

Chart of the Day: Corporate Profits Unimpressive?
Jobless Claims Higher Than Expected But Still Sub 250K
Jobless claims came in higher than expected this week, rising to 244K from 242K. Make no mistake, though, with claims coming in below 250K for the fourth straight week and below 300K for the 121st straight week, claims are extraordinarily low by historical standards. Also, as shown in the inset chart below, claims continue to trend lower.
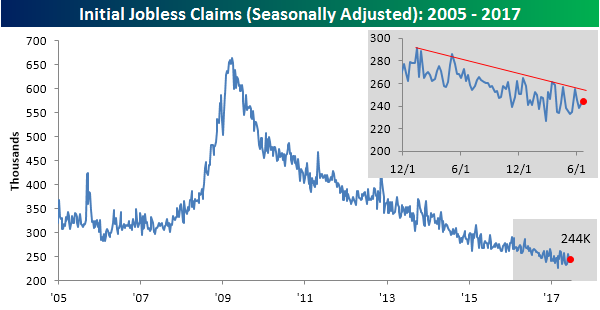
The four-week moving average for claims fell by 2.75K this week to 242.25K, which is 6.75K above the post-recession low of 235.5K seen six weeks ago back in mid-May.
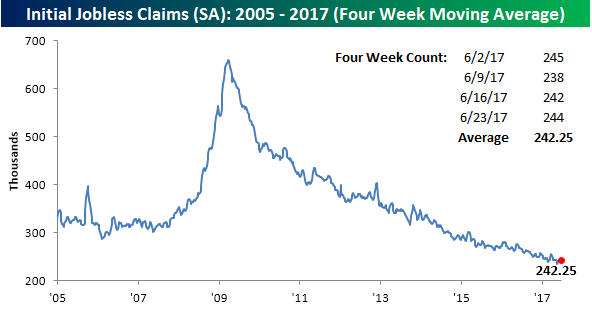
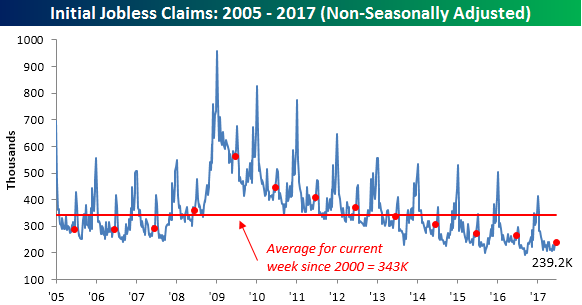
On a non-seasonally adjusted (NSA) basis, jobless claims rose by just over 10K to 239.2K. While that’s up, at this time of year it is common for claims to increase, so for the current week of the year, the NSA reading was still more than 100K below its average since 2000 for the current week of the year, and the lowest weekly print for this specific week since 1973.
ETF Trends: US Indices & Styles – 6/29/17
After topping our list of worst performers last week, Coffee finds itself atop our list of best performers this week, up almost 9%. Oil ETFs made a similar transition, specifically DB Oil, which is up almost 6% after hitting a new 52-week low last week. Banks and Financials are other notable outperformers. On the losing side, Real Estate, Utilities, and Biotech are underperformers along with the US Dollar Index.

Bespoke provides Bespoke Premium and Bespoke Institutional members with a daily ETF Trends report that highlights proprietary trend and timing scores for more than 200 widely followed ETFs across all asset classes. If you’re an ETF investor, this daily report is perfect. Sign up below to access today’s ETF Trends report.
See Bespoke’s full daily ETF Trends report by starting a no-obligation free trial to our premium research. Click here to sign up with just your name and email address.
Market Hangs in Without Tech and FAANG
Remember all those stories earlier this year that the market was being powered by the performance of the large-cap technology sector and more specifically, the FAANG (originally FANG, but Apple was added after it started to rally) stocks? The “theory” was that if these stocks ever ran into trouble, look out below. Throughout this period, we took the opposite end of the argument and repeatedly highlighted that although the FAANG stocks were doing extremely well, overall breadth in the market was strong, indicating broad-based participation.
Well, this month we got the first test of the FAANG theory and how much or little it was holding up the market. Since the close on June 8th, the S&P 500 Technology sector has dropped 2.6% and the five FAANG stocks have declined over 4%.
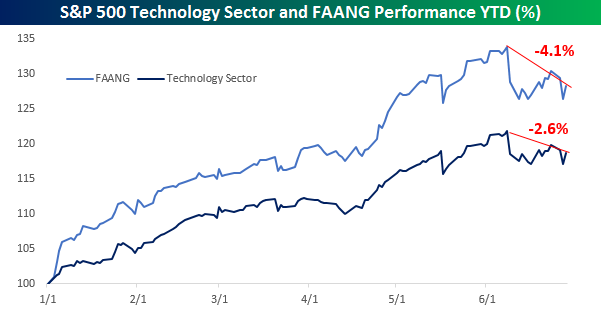
So how much did the overall market decline in reaction to the fall in the tech sector. Heading into Thursday’s trading, the S&P 500 is down less than half a percent.
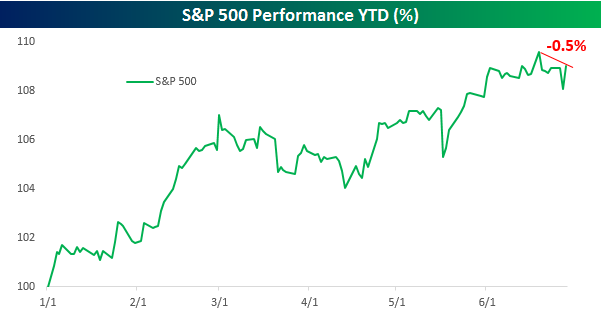
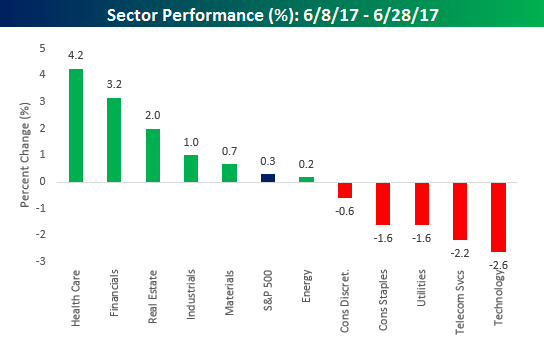
The key to the market’s resilience in the face of Tech’s weakness has been strength in sectors like Health Care (+4.2%), Financials (+3.2%), and Real Estate (+2.0%). In fact, while the S&P 500 is down half a percent from its bull market high, it is actually up 0.3% since the Technology sector peaked.
Notable Moves in Sentiment
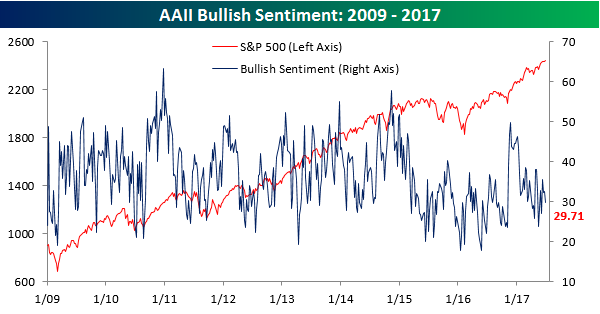
The weekly sentiment survey results from AAII were just released, and while bullish sentiment is still nowhere near 50% and well below historical averages, there were some notable moves nonetheless. In terms of bullish sentiment, optimism declined this week falling from 32.65% down to 29.71% (what else is new). That now makes it a record 130 straight weeks where half of the investors surveyed were not bullish.
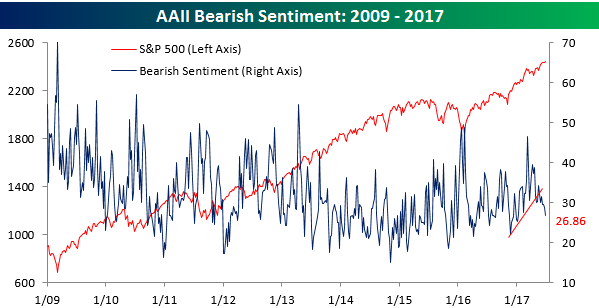
Even as bullish sentiment declined, bearish sentiment also shrank, falling from 28.91% down to 26.86%. That represents the lowest reading in bearish sentiment since the first week of the year. Looking at the chart, negative sentiment has really started to decline ever since that mini-uptrend was broken several weeks back.
With both the numbers of bulls and bears continuing to thin, there has been a bull market in neutral sentiment. In this week’s survey, the percentage of investors who couldn’t make up their minds ballooned to 43.43% or the highest reading since last August. Let’s just call them cautiously optimistic, or better yet, optimistically cautious.

The Closer — Dollar Dour, MSA Jobs, And Negative NIIP — 6/28/17
Log-in here if you’re a member with access to the Closer.
Looking for deeper insight on global markets and economics? In tonight’s Closer sent to Bespoke Institutional clients, we review which currencies have driven the 7.9% decline off January highs for the Bloomberg USD Index. We also review May metropolitan statistical area (MSA) employment and unemployment data from the BLS, and Q1 net international investment position data from the BEA.

The Closer is one of our most popular reports, and you can sign up for a free trial below to see it!
The Closer is one of our most popular reports, and you can see it and everything else Bespoke publishes by starting a no-obligation 14-day free trial to our research!
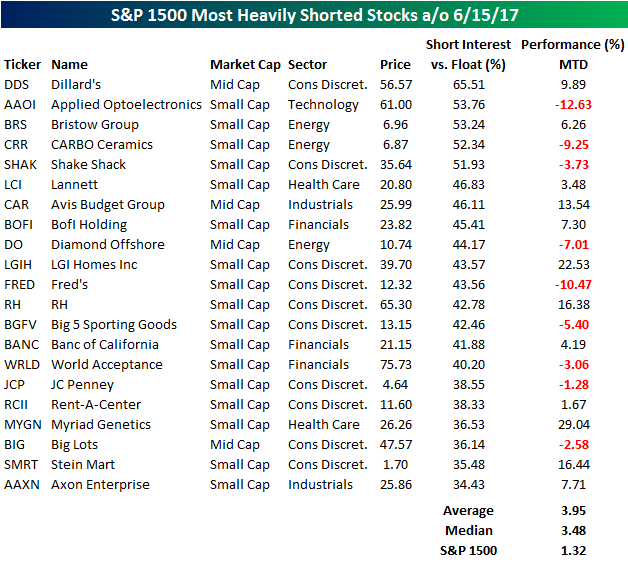
S&P 1500 Most Heavily Shorted Stocks
Short interest data for the middle of June was released by the major exchanges on Monday, and below we have highlighted the 21 stocks in the index with more than a third of their float sold short. For each of the stocks listed, we have also included its performance so far in June. While 21 stocks have more than a third of their free floating stocks sold short, five actually have more than half of their float sold short. That’s some pretty negative sentiment!
The title of most heavily shorted stock in the S&P 1500 goes to- wait for it now- surprise, a retailer! Shares of Dillard’s (DDS) not only have half of their float sold short, but nearly two-thirds of its float is currently sold short. You don’t see that very often. Behind DDS, the remaining four stocks in the S&P 1500 with more than half of their float sold short are Applied Optoelectornics (AAOI), Bristow (BRS), CARBO Ceramics (CRR), and Shake Shack (SHAK).
In terms of performance so far this month, the most heavily shorted stocks in the S&P 1500 have done well so far this month averaging a gain of 3.95% (median: 3.48%) compared to a gain of 1.32% for the S&P 1500. The biggest winners have been Myriad Genetics (MYGN) and LGI Homes (LGIH) which are both up over 20%. Not all of the most shorted stocks have been winners, though. Both Applied Optoelectronics (AAOI) and Fred’s (FRED) are both down over 10%.
For anyone who has been tracking our posts on short interest over time will already know, the most heavily shorted stocks have been underperforming the broader market for several months now. The fact that we are now seeing some improvement in terms of relative strength, suggests that investors may be opening up to the idea of moving into riskier stocks.
B.I.G. Tips – July 2017 Seasonality
ETF Trends: Fixed Income, Currencies, and Commodities – 6/28/17
Steel, Natural Gas, and Solar are among those leading the pack this week, all up more than 5%. Retail made a nice recovery and is up about 5% this week after being down 5% last week. Biotech moved in the opposite direction, down about 1% this week. Other notable underperformers are Real Estate, Utilities, and Tech.
Bespoke provides Bespoke Premium and Bespoke Institutional members with a daily ETF Trends report that highlights proprietary trend and timing scores for more than 200 widely followed ETFs across all asset classes. If you’re an ETF investor, this daily report is perfect. Sign up below to access today’s ETF Trends report.
See Bespoke’s full daily ETF Trends report by starting a no-obligation free trial to our premium research. Click here to sign up with just your name and email address.