The Closer — Big BoC, Survey of Quits — 7/11/17
Log-in here if you’re a member with access to the Closer.
Looking for deeper insight on global markets and economics? In tonight’s Closer sent to Bespoke Institutional clients, we preview the BoC, followed by a summary of quit rates across industries as-of the May JOLTS report released by the BLS today.

The Closer is one of our most popular reports, and you can sign up for a free trial below to see it!
The Closer is one of our most popular reports, and you can see it and everything else Bespoke publishes by starting a no-obligation 14-day free trial to our research!
B.I.G. Tips – Same Headline, Different Quarter: Analysts Still Negative
ETF Trends: US Sectors & Groups – 7/11/17
Semiconductors highlight this week’s list of best performing ETFs that we track, up about 4.5% this week after seeing almost a 4% decrease last week. The rest of our best performers are filled out mostly by countries, most notably Mexico, India, and Latin America. Oil’s struggles continue, with these struggles even larger in magnitude when compared to recent sessions. Other notable underpeformers are Retail, Energy, and Real Estate.

Bespoke provides Bespoke Premium and Bespoke Institutional members with a daily ETF Trends report that highlights proprietary trend and timing scores for more than 200 widely followed ETFs across all asset classes. If you’re an ETF investor, this daily report is perfect. Sign up below to access today’s ETF Trends report.
See Bespoke’s full daily ETF Trends report by starting a no-obligation free trial to our premium research. Click here to sign up with just your name and email address.
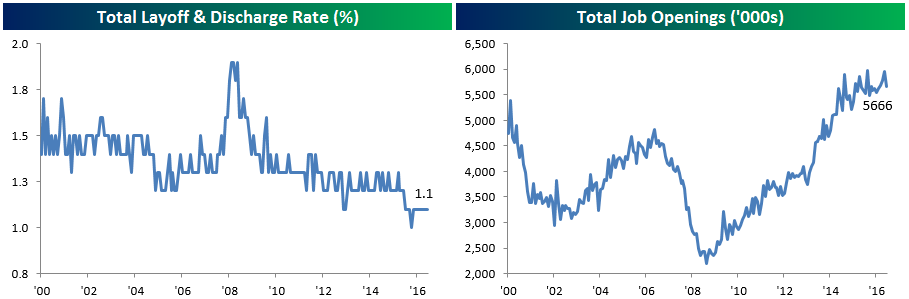
Quits Impress
Job openings missed expectations today, with a little over 5.66 million reported by employers in May versus expectations for nearly 6.00 million. As shown in the chart right below, that level openings is about where things have stood since mid-2014. The 12m average of job openings is still rising – slowly – but has flattened out quite dramatically as the total number has swung back and forth in its current range. While openings are basically stable, firings remain extremely rare, near record lows.
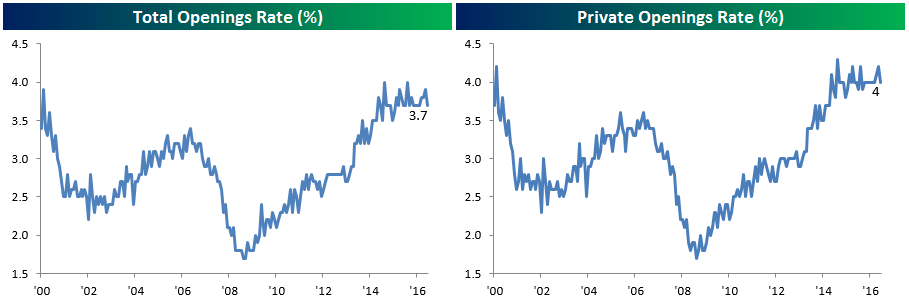
With the total number of openings basically stable, openings for the whole economy and the private sector are similarly stable.
Another measure of labor market activity is the separations rate. A function of both willing (quits) and unwilling (layoffs, discharges, and other separations like retirement, death, or disability) job exits, the total separations rate has remained relatively low. That’s in large part because of low firings.

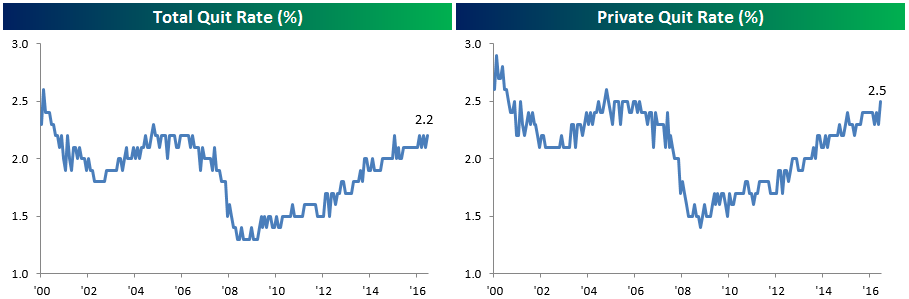
Where there was good news in the JOLTS report was in the quits rate. Total quits are up to 2.2%, a high that’s been hit previously in this expansion. For the private sector only, however, it’s a much stronger story. Quits are up to 2.5%, a rate surpassed only once in the prior expansion. That’s good news for wage growth and evidence that labor markets continue to tighten.
Bespoke Stock Scores: 7/11/17
Chart of the Day: Happy Prime Day (Unless You’re a Retailer)
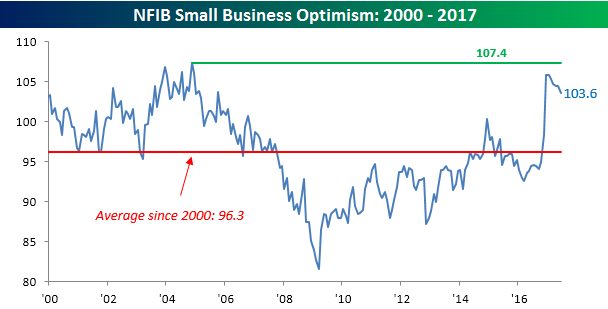
Small Business Optimism Weaker Than Expected
Small Business Optimism from the NFIB came in weaker than expected for the month of June, falling from 104.5 down to 103.6. Economists had been forecasting a level of 104.4. To illustrate just how strong this index has been of late, the 0.9 point downside move in June represents the largest m/m decline since February 2016! Following June’s decline, the recent moves in the NFIB can be looked at from two different perspectives. On the optimistic side, the index is still well above its historical average of 96.3 going back to 2000. From the pessimistic side, however, the index has clearly lost momentum following the post-election surge, and in the process, it fell short of reaching its highs from the prior expansion. The jury is still out on which side will prove to be correct.
Click here to start a no-obligation two-week free trial to our premium research platform.
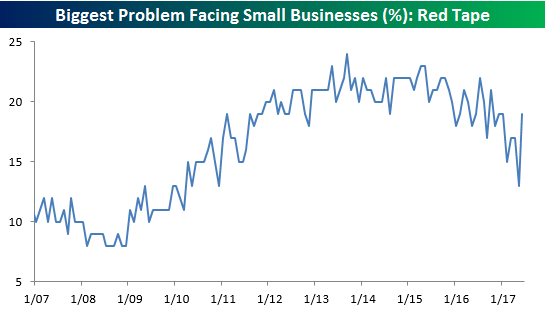
In terms of what issues small business owners consider to be their biggest problems, this month we saw some interesting moves. The biggest of these was in Government Red Tape, which was cited by 19% of small business owners and up from 13% in May. On a m/m basis, no other ‘problem’ saw an increase of more than 1 percentage point. On the downside, respondents who were worried about the Quality of Labor and Cost of Insurance seem less worried now and instead are more focused on red tape.

This month’s increase in the percentage of respondents citing Government Red Tape as their number one problem is noteworthy due to the fact that it is the largest m/m increase on record. Obviously, delays in Washington on reforming health care and reigning in regulations is weighing on sentiment. Prior to this month, the two largest m/m increases in the “problem” of red tape were in January 2009 (Obama Inauguration) and April 2010 (the month after the Affordable Care Act was signed into law). Amazingly, even after this month’s increase, the percentage of small business owners citing Government Red Tape as their number one problem is below where it was last October before the election.
Click here to start a no-obligation two-week free trial to our premium research platform.
The Closer — Dollar Rates, Consumer Credit, European Population — 7/10/17
Log-in here if you’re a member with access to the Closer.
Looking for deeper insight on global markets and economics? In tonight’s Closer sent to Bespoke Institutional clients, we discuss the valuation of the US dollar, consumer credit growth reported this afternoon, and Eurostat’s new estimates for the European Union’s population.
The Closer is one of our most popular reports, and you can sign up for a free trial below to see it!
The Closer is one of our most popular reports, and you can see it and everything else Bespoke publishes by starting a no-obligation 14-day free trial to our research!
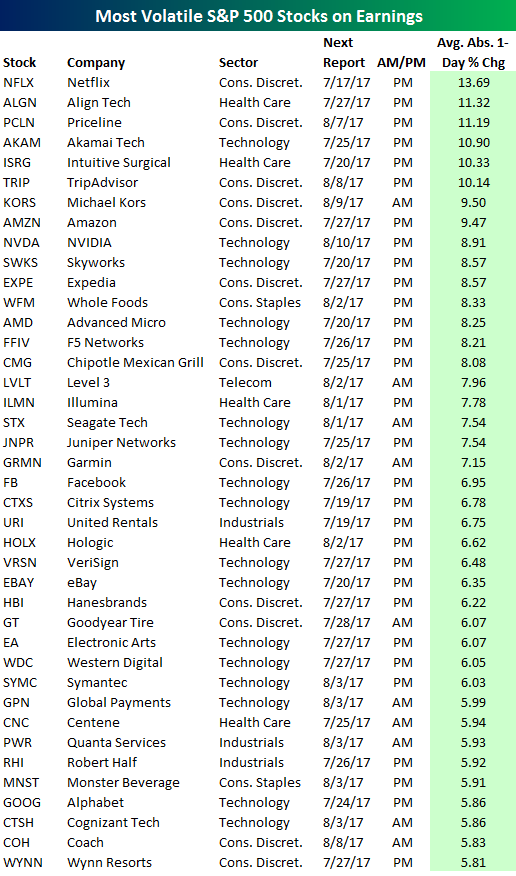
Most Volatile Stocks on Earnings
At the start of each earnings season, we provide an updated list of the most volatile stocks on earnings. Using our Interactive Earnings Database, below is a list of the S&P 500 stocks set to report earnings over the next month that have historically had the biggest price swings on their earnings reaction days. (For stocks that report before the open, their earnings reaction day is that trading day. For stocks that report after the close, their earnings reaction day is the next trading day.)
As shown, Netflix (NFLX) is the most volatile S&P 500 stock on earnings with an average move of +/-13.69% on its earnings reaction day. Align Tech (ALGN) ranks second at +/-11.32%, followed by Priceline (PCLN) in third at +/-11.19%. Akamai (AKAM), Intuitive Surgical (ISRG), and TripAdvisor (TRIP) are the only other stocks in the S&P that average one-day swings of more than 10% on their earnings reaction days.
Other stocks in the S&P 500 that experience huge moves in reaction to earnings include names you might expect like Amazon (AMZN), NVIDIA (NVDA), AMD, Chipotle (CMG), Facebook (FB), Alphabet (GOOG), and Wynn Resorts (WYNN). What is somewhat of a surprise, though, is that many of these stocks are now among the largest in the world. For such large stocks to see large swings like that is uncommon relative to history.
Next to each stock we also include when it’s expected to report this season, so keep an eye out if you own or follow any of these volatile large-cap names.
The table above highlights the most volatile S&P 500 stocks set to report earnings over the next month. Below is a list that looks at all stocks traded on US exchanges. The 40 stocks below must have at least 12 earnings reports (3 years worth of earnings) on file. As shown, Groupon (GRPN) is the single most volatile stock on earnings in the US that’s set to report over the next month. When it reports earnings, it typically moves up or down roughly 18% on its earnings reaction day. That’s a big move considering that it happens once every 3 months!
Rubicon Project (RUBI) is the second most volatile stock on earnings at +/-16.51%, followed by ServiceSource Intl (SREV), YELP, ChannelAdvisor (ECOM), and Rocket Fuel (FUEL). Other notables on the list include LendingTree (TREE), Netflix (NFLX), Tableau Software (DATA), First Solar (FSLR), FireEye (FEYE), and Twitter (TWTR).
Click here to start a no-obligation two-week free trial to our premium research service which includes more in-depth earnings season analysis.
