The Closer — Toronto Home Prices, Fedspeak, Central Bank Doldrums, CoT Update — 8/14/17
Log-in here if you’re a member with access to the Closer.
Looking for deeper insight on global markets and economics? In tonight’s Closer sent to Bespoke Institutional clients, we review Canadian home price data released today, recent FOMC speeches, upcoming central bank meetings, and positioning recaps from the Commitment of Traders report released by the CFTC Friday.

The Closer is one of our most popular reports, and you can sign up for a free trial below to see it!
See today’s post-market Closer and everything else Bespoke publishes by starting a no-obligation 14-day free trial to our research platform!
Chart of the Day: Irrational Exuberance Indicator
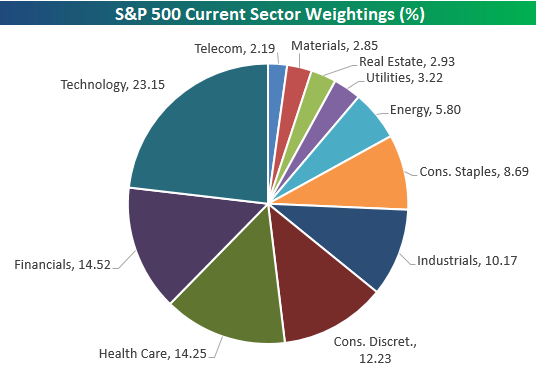
Updated 2017 S&P 500 Sector Weightings
Below is an updated look at where S&P 500 sector weightings stand as of August 14th, 2017. The Technology sector’s weighting remains above 23% at 23.15%. That’s just 22 basis points below its multi-year high of 23.37% set during the week of June 9th, 2017. Financials and Health Care are battling it out in second and third place with weightings of 14.52% and 14.25%, respectively.
Consumer Discretionary ranks fourth at 12.23%, Industrials is fifth at 10.17%, and Consumer Staples is sixth at 8.69%. Consumer Staples just dipped to its lowest weighting since March 2002!

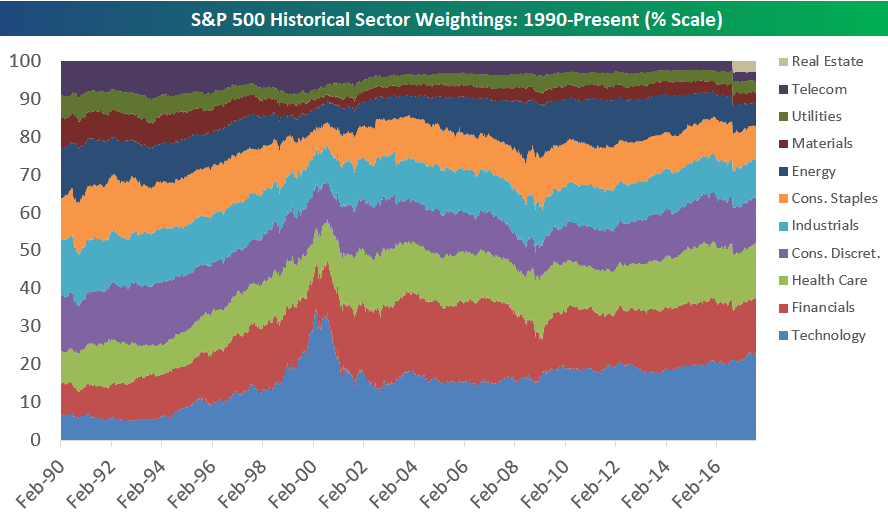
Below is a look at S&P 500 sector weightings going back to 1990. This allows you to see how things have shifted over the years. In the early 90s prior to the Tech bubble, the economy was much more evenly distributed. In early 1990, Industrials was the largest sector of the market at 14.72%. That’s 8.5 percentage points below Tech’s weighting now. In 1990, Technology was actually the second smallest in the S&P 500 with a weighting of 6.34%! How times have changed.
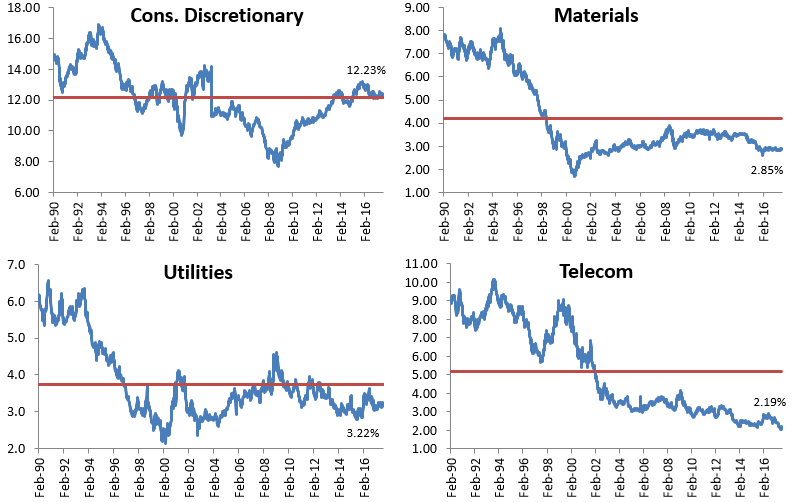
The charts below break out the path of each sector’s S&P 500 weighting over time. The red line in each chart represents the sector’s average weighting over the entire time frame, so you can see which sectors are currently the furthest above or below their long-term averages. Technology and Health Care are the only two sectors currently well above their long-term averages. Consumer Staples, Energy, Industrials, Materials, Telecom and Utilities are all well below their long-term averages.

ETF Trends: Fixed Income, Currencies, and Commodities – 8/14/17
Bespoke Stock Seasonality: 8/14/17
The Bespoke Report – 8/11/17 – In One Way, Out the Other
Bespoke’s S&P 500 Weekly Chart Book — 8/11/17
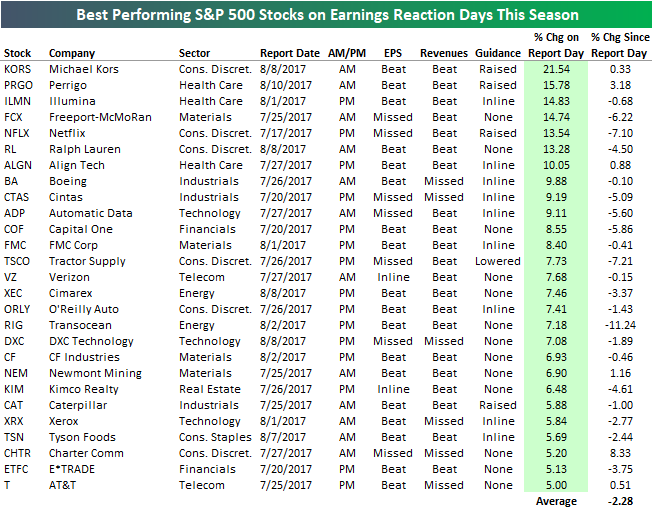
Best and Worst Performing S&P 500 Stocks on Earnings
While the average stock that has reported earnings this season has gone down 0.82% on its earnings reaction day, there have of course been some big winners. There are 27 stocks in the S&P 500 that have gained 5% or more on their earnings reaction days so far this season (which began on July 10th). These 27 stocks are listed in the table below.
As shown, Michael Kors (KORS) tops the list with a one-day gain of 21.54% that it saw on August 8th after earnings. Perrigo (PRGO) ranks 2nd with a gain of 15.78%, followed by Illumina (ILMN), Freeport-McMoRan (FCX), and Netflix (NFLX). Other notables on the list of earnings season winners include Boeing (BA), Verizon (VZ), Caterpillar (CAT), and AT&T (T).
One more thing — while these stocks saw huge gains on their earnings reaction days, they’ve on average declined by 2.28% since then. This means there hasn’t been much upside follow-through for the stocks that initially reacted the most positively to earnings.
Start a 30-day free trial to Bespoke’s Premium service for our most actionable ideas.
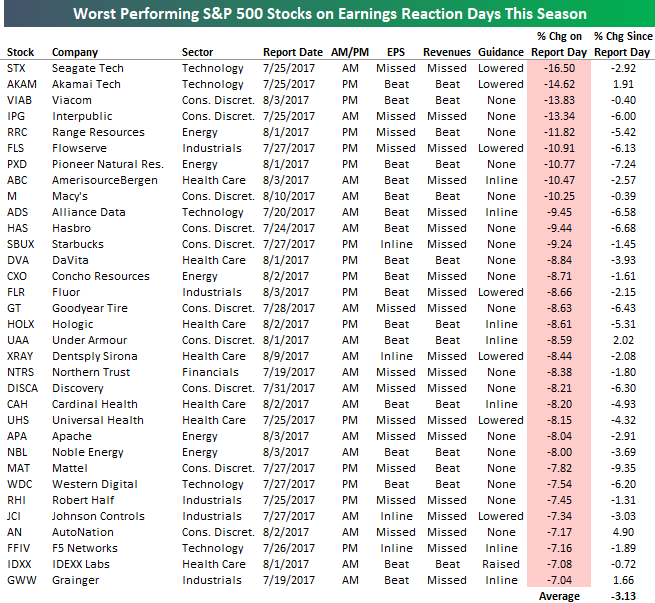
While there have been 27 S&P 500 stocks that have gained 5% or more on their earnings reaction days this season, there have been a lot more than have fallen 5% or more. Sixty-two in fact.
Below is a list of this season’s biggest losers in the S&P 500. Seagate Tech (STX) ranks at the top with a one-day drop of 16.5%, followed by Akamai (AKAM), Viacom (VIAB), and Interpublic (IPG). Other notables on the list of earnings season losers include Macy’s (M), Starbucks (SBUX), Under Armour (UAA), and Johnson Controls (JCI).
Above we pointed out that the biggest earnings season winners have seen no upside follow-through after their initial jumps. The biggest losers also haven’t seen any kind of bounce since their big drops. On average, the stocks below have fallen another 3.13% since the close on their earnings reaction days.
Stocks Selling Off Post Earnings
Nearly 2,500 companies have reported earnings since the current earnings season began, and the average stock that has reported has actually fallen 0.82% on its earnings reaction day. Notably as well is that stocks that have reported have continued to fall even after their initial earnings reaction day.
Below is a chart detailing this trend. As shown, companies that have beaten earnings estimates have averaged a small gain of 0.81% on their earnings reaction days this season. Companies that have missed EPS estimates have gotten hit hard, however, with a one-day drop of 3.61%.
Once the initial earnings reaction day passes, investors have been hitting the “Sell” button, regardless of whether the company beat or missed. While stocks that have beaten EPS have averaged a small gain on their earnings reaction days, they’re down an average of 2.63% since then. That’s actually worse than the average decline of 2.02% that stocks that have missed EPS estimates have seen since their earnings reaction days.
There’s been lots of commentary about this being the strongest earnings season in years in terms of actual earnings growth. But based on how stock prices have been reacting to their earnings reports, it looks like that strength was fully priced in well in advance of the start of the third quarter.
Start a 30-day free trial to Bespoke’s Premium service for our most actionable ideas.

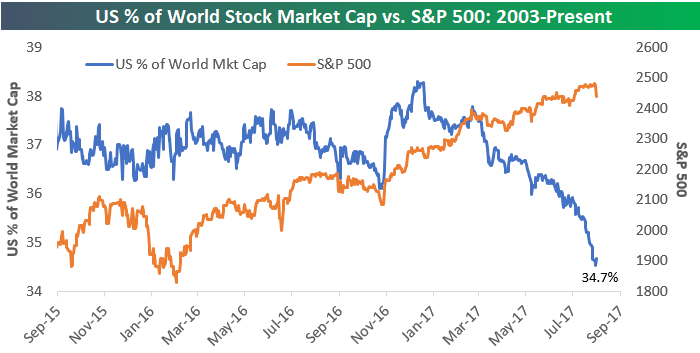
US Equity Share Continues to Drop
Start a 30-day free trial to Bespoke’s Premium service for our most actionable ideas.
We continue to monitor the drop in the share of world market cap that the US stock market makes up. It has been falling like a rock all year, and it dipped another 46 basis points since the start of August.
Below is a chart showing the US’ % of world stock market cap going back to 2003 (blue line). We’ve also overlaid a chart of the S&P 500 over the same time period. There’s lots to glean from the historical trend going back to the turn of the millennium, but we want to focus on the last two years. As you can see, even though the S&P 500 has blown out to new all-time highs on a regular basis since the end of 2016, the country’s share of total stock market cap has been falling. The reasons? Other countries have seen their stock markets perform even better than the US, and the US Dollar has been falling.
While President Trump can claim that the stock market has done exceptionally well since he was elected, he’s actually overseen a huge loss in the US’ share of total world stock market cap. When grading a Presidency, you could argue that the latter is actually more important.
Start a 30-day free trial to Bespoke’s Premium service for our most actionable ideas.