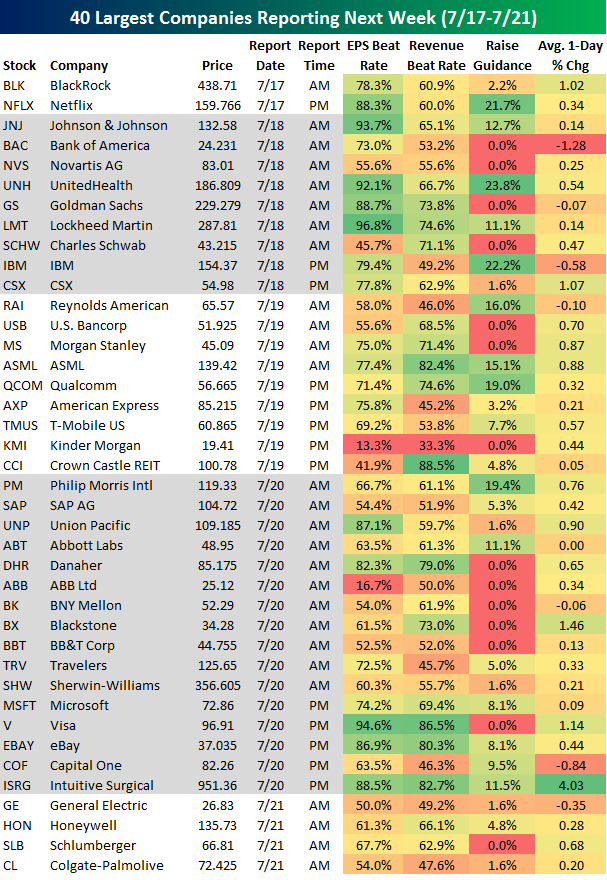
Key Earnings to Watch Next Week
Using our Interactive Earnings Calendar, below is a list of the 40 largest companies set to report earnings next week. On Monday we kick things off with Blackrock (BLK) in the morning and Netflix (NFLX) after the close. JNJ, Bank of America (BAC), Goldman (GS), and IBM are the biggest names on deck for Tuesday, while Morgan Stanley (MS), Qualcomm (QCOM), and American Express (AXP) take the lead on Wednesday. Thursday is the busiest day next week with companies like Microsoft (MSFT), eBay (EBAY), Visa (V), and Travelers (TRV) set to report, and then General Electric (GE), Honeywell (HON), and Schlumberger (SLB) close out the week on Friday.
Of the stocks listed below, Lockheed Martin (LMT), Johnson & Johnson (JNJ), UnitedHealth (UNH), and Visa (V) have historically beaten earnings estimates at the highest rate (all above 90%), while Intuitive Surgical (ISRG) has historically reacted the most positively on its earnings reaction day (far right column). Bank of America (BAC), IBM, and Capital One (COF) have historically reacted the most negatively on their earnings reaction days.
ETF Trends: US Indices & Styles – 7/14/17
Six countries lead our list of best performing ETFs in this week’s ETF Trends Report, most notably Brazil, Turkey, and South Africa, who are all up more than 7%. Oil and Steel are other noteworthy outperformers. Banks, Telecoms, and Financials are among the worst performing ETFs this week. Interestingly, only 14 of the ETFs that we track saw decreases.

Bespoke provides Bespoke Premium and Bespoke Institutional members with a daily ETF Trends report that highlights proprietary trend and timing scores for more than 200 widely followed ETFs across all asset classes. If you’re an ETF investor, this daily report is perfect. Sign up below to access today’s ETF Trends report.
See Bespoke’s full daily ETF Trends report by starting a no-obligation free trial to our premium research. Click here to sign up with just your name and email address.
Bespoke Industry Insights — Autonomous Vehicles — 7/14/17
Today we’ve published the fourth edition of our “Industry Insights” report that’s available to Bespoke Institutional subscribers. Our “Industry Insights” report provides more in-depth industry/sector/group coverage than we’ve previously offered. In our newest report, we cover investing in “Autonomous Vehicles.” This one is a must read.
Below is a snapshot of the first page from this month’s report. To access the full 10-page PDF, sign up for a two-week free Bespoke research trial today. In addition to this report, you’ll receive everything else we publish on a daily basis, starting with our Morning Lineup and finishing with The Closer each night.

The Closer — Outlays Accelerate, Producer Prices & Consumer Sentiment Don’t — 7/13/17
Log-in here if you’re a member with access to the Closer.
Looking for deeper insight on global markets and economics? In tonight’s Closer sent to Bespoke Institutional clients, we review monthly outlays, receipts, and deficits for the federal government, update tracking of consumer sentiment, and recap the BLS PPI report from today.

The Closer is one of our most popular reports, and you can sign up for a free trial below to see it!
The Closer is one of our most popular reports, and you can see it and everything else Bespoke publishes by starting a no-obligation 14-day free trial to our research!
Bespoke’s Sector Snapshot — 7/13/17
We’ve just released our weekly Sector Snapshot report (see a sample here) for Bespoke Premium and Bespoke Institutional members. Please log-in here to view the report if you’re already a member. If you’re not yet a subscriber and would like to see the report, please start a 14-day trial to Bespoke Premium now.
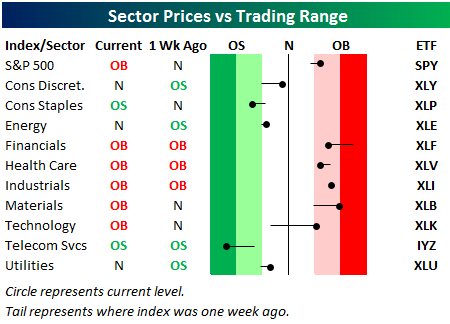
Below is one of the many charts included in this week’s Sector Snapshot, which highlights our trading range screen for the S&P 500 and ten sectors. For each sector, the dot represents where it’s currently trading, while the tail end represents where it was trading one week ago. The black vertical “N” line represents each sector’s 50-day moving average, and moves into the red or green zones are considered overbought or oversold.
As you can see, the S&P 500 and five sectors have moved back into overbought territory after experiencing a pullback over the prior two weeks. The Technology sector has seen the biggest bounce over the last week, moving from below its 50-day moving average up into overbought territory.
To see our full Sector Snapshot with additional commentary plus six pages of charts that include analysis of valuations, breadth, technicals, and relative strength, start a 14-day free trial to our Bespoke Premium package now. Here’s a breakdown of the products you’ll receive.
Bespoke Short Interest Report – 7/13/17
Short interest figures for the end of June were released after the close on Wednesday, so we have just updated our regular report on short interest trends for the market, sectors, and individual stocks for clients. Below we wanted to quickly highlight the stocks with the highest levels of short interest as a percentage of float. Through the end of June, there were 16 stocks in the S&P 1500 that had more than 40% of their free-floating shares sold short. Through Wednesday’s close, the stocks on this list were down an average of 2.46% (median: -0.92%) month to date compared to a gain of 0.79% for the S&P 1500 as a whole. So, in the first half of the month at least, the most heavily shorted stocks are underperforming by a wide margin.
One stock that isn’t lagging the market, though, is Applied Optoelectronics (AAOI). Through Wednesday, the stock was up over 17% in July, and that doesn’t even include Thursday’s 6% gain after the company raised guidance below the open. The only other stock listed that is up more than 5% this July is Avis Budget (CAR). On the downside, shares of retailer Fred’s (FRED) are down over 30% in July, helicopter transportation provider Bristow Group (BRS) is down 14%, while Big 5 Sporting Goods (BGFV) is down 12%.
For a more detailed look at short interest data on a regular basis, sign up for a monthly Bespoke Premium membership now!
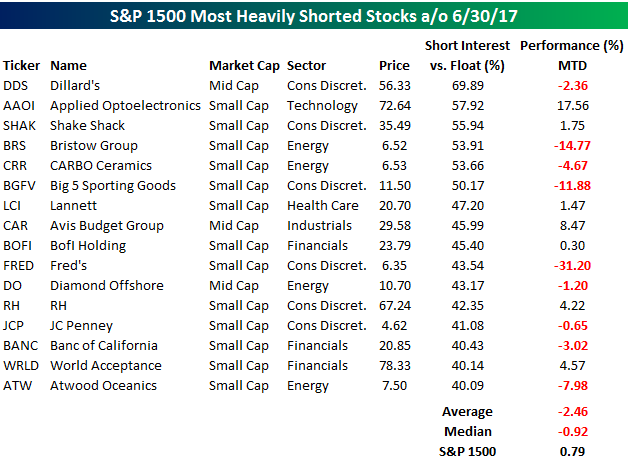
Chart of the Day: Unfriend Social Media Upstarts
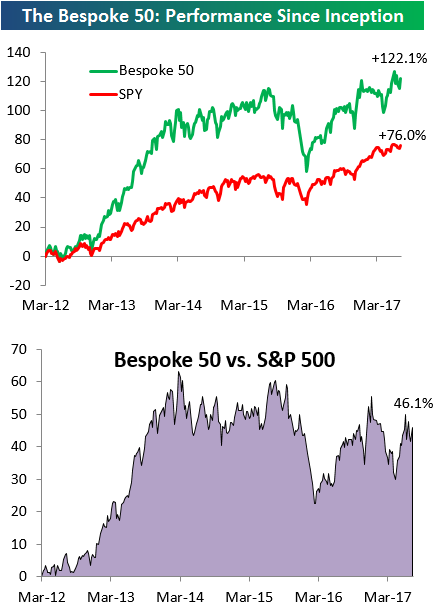
the Bespoke 50 — 7/13/17
Every Thursday, Bespoke publishes its “Bespoke 50” list of top growth stocks in the Russell 3,000. Our “Bespoke 50” portfolio is made up of the 50 stocks that fit a proprietary growth screen that we created a number of years ago. Since inception in early 2012, the “Bespoke 50” has beaten the S&P 500 by 46.1 percentage points. Through today, the “Bespoke 50” is up 122.1% since inception versus the S&P 500’s gain of 76.0%. Always remember, though, that past performance is no guarantee of future returns.
To view our “Bespoke 50” list of top growth stocks, sign up for Bespoke Premium ($99/month) at this checkout page and get your first month free. This is a great deal!
ETF Trends: Fixed Income, Currencies, and Commodities – 7/13/17
Countries continue to outperform in this week’s ETF Trends report. Brazil, Latin America, Turkey, and Mexico are all up more than 4%, with Turkey making the biggest improvement after being down almost 3% last week. Semiconductors and Solar also continue their strong performance. On the losing side, Telecoms headline a group that has shown consistent underperformance over the past couple sessions, along with Silver and Gold. Biotech is another noteworthy underperformer, down almost 1%.

Bespoke provides Bespoke Premium and Bespoke Institutional members with a daily ETF Trends report that highlights proprietary trend and timing scores for more than 200 widely followed ETFs across all asset classes. If you’re an ETF investor, this daily report is perfect. Sign up below to access today’s ETF Trends report.
See Bespoke’s full daily ETF Trends report by starting a no-obligation free trial to our premium research. Click here to sign up with just your name and email address.
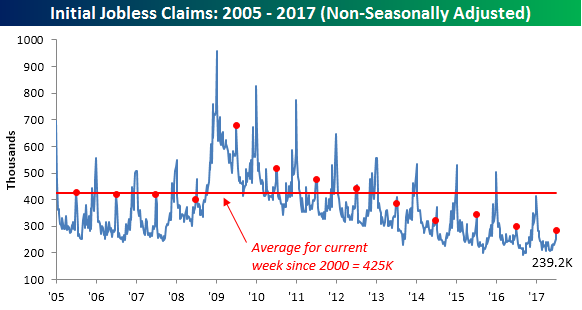
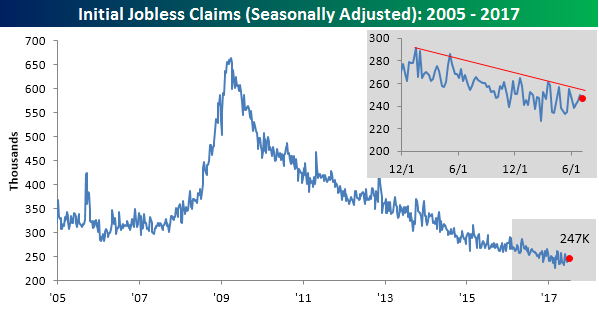
Jobless Claims: Still Low
Although Jobless Claims declined this week, they did come in higher than expected, but the moves were slight at best. While economists were looking for first-time claims to come in at 245K, the actual reading was a 3K decline from a revised reading of 250K. Just to update some of the amazing streaks we have seen in these numbers, though, weekly claims have been at or below 250K for six straight weeks and below 300K for 123 straight weeks. That’s over two years.
Click here to start a no-obligation two-week free trial to our premium research platform.
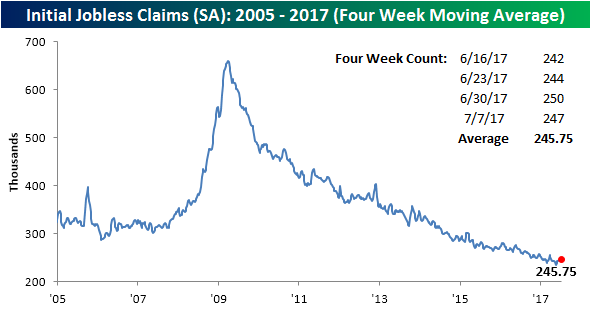
Given the small weekly moves we have seen in recent weeks, the four-week moving average has also stalled out of late. This week’s reading showed a slight increase to 245.75K. That’s now just over 10K above the multi-decade low of 235.5K that we saw back in mid-May.
On a non-seasonally adjusted basis, claims rose by a seemingly large 31K. While that sounds like a big increase, it is common for claims to rise at this time of year. In fact, the current level is more than 140K below the average of 424.5K for the current week of the year dating back to 2000, and to find a week at this time of year with a lower reading, you have to go all the way back to 1969!
Click here to start a no-obligation two-week free trial to our premium research platform.