Jobless Claims Show Further Improvement
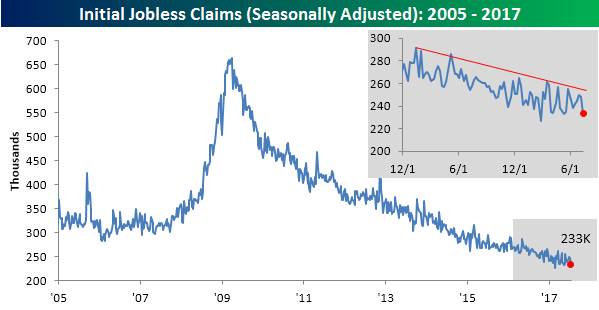
Jobless claims have been strong for some time now, but this week’s report was strong, even relative to recent trends. While economists were forecasting first time claims to come in at 245K, the actual reading was 12K lower at 233K, which is tied for the second lowest weekly reading of the entire expansion. Claims have now been at or below 250K for seven straight weeks and below 300K for an astonishing 124 weeks.
Start a two-week free trial to Bespoke’s research platform to see our full offering.
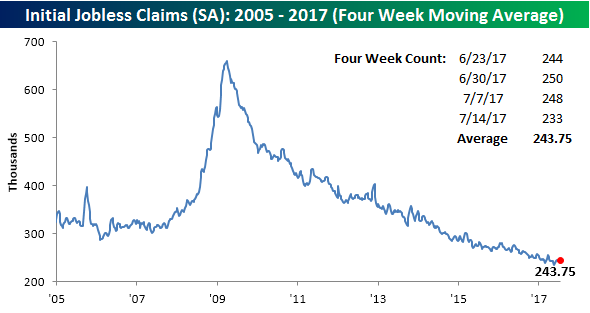
With this week’s decline, the four-week moving average dropped down to 243.75K from last week’s reading of 246K. While the four-week moving average has now gone nine weeks without making a new low, it is currently just 8.25K above that multi-decade low from mid-May. A few more weeks like this week’s report and we may just get there.
On a non-seasonally adjusted basis, jobless claims dropped 28.1K down to 256.6K from last week’s level of 284.7K. That’s more than 159K below the average of 416K for the current week of the year dating back to 2000. More importantly, the last time claims were this low for the current week of the year was 49 years ago in 1968!
Start a two-week free trial to Bespoke’s research platform to see our full offering.

Chart of the Day: Risky REITs
ETF Trends: Fixed Income, Currencies, and Commodities – 7/20/17
Solar continues to outperform among the universe of ETFs we track daily, along with South Africa, Norway, and Silver, which are all up over 4%. Turkey is also among our best performers, continuing the trend of strong performance from European countries. Oil and Energy also saw solid gains. On the losing side, Transports is the only ETF down more than 2%, with Israel and Sweden not far behind. The US Dollar continues its downward spiral, as other notables Banks and Financials fell as well.

Bespoke provides Bespoke Premium and Bespoke Institutional members with a daily ETF Trends report that highlights proprietary trend and timing scores for more than 200 widely followed ETFs across all asset classes. If you’re an ETF investor, this daily report is perfect. Sign up below to access today’s ETF Trends report.
See Bespoke’s full daily ETF Trends report by starting a no-obligation free trial to our premium research. Click here to sign up with just your name and email address.
the Bespoke 50 — 7/20/17
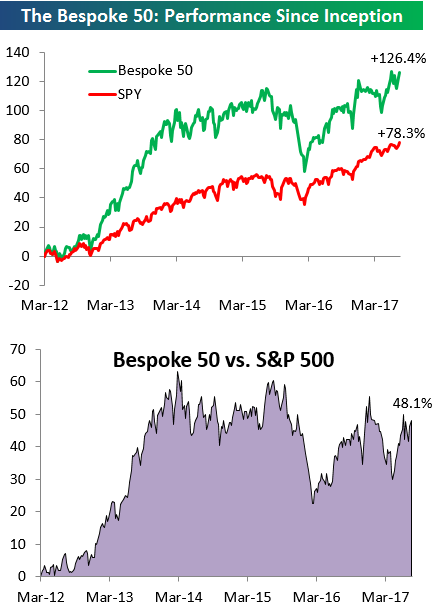
Every Thursday, Bespoke publishes its “Bespoke 50” list of top growth stocks in the Russell 3,000. Our “Bespoke 50” portfolio is made up of the 50 stocks that fit a proprietary growth screen that we created a number of years ago. Since inception in early 2012, the “Bespoke 50” has beaten the S&P 500 by 48.1 percentage points. Through today, the “Bespoke 50” is up 126.4% since inception versus the S&P 500’s gain of 78.3%. Always remember, though, that past performance is no guarantee of future returns.
To view our “Bespoke 50” list of top growth stocks, sign up for Bespoke Premium ($99/month) at this checkout page and get your first month free. This is a great deal!
The Closer — Long Charts, Short Words — 7/19/17
Log-in here if you’re a member with access to the Closer.
Looking for deeper insight on global markets and economics? In tonight’s Closer sent to Bespoke Institutional clients, we chart up monthly residential construction numbers. We also take a look at the strong performance of oil market data in the US of late, and an attractive technical setup.

The Closer is one of our most popular reports, and you can sign up for a free trial below to see it!
The Closer is one of our most popular reports, and you can see it and everything else Bespoke publishes by starting a no-obligation 14-day free trial to our research!
Bespoke’s Global Macro Dashboard — 7/19/17
Bespoke’s Global Macro Dashboard is a high-level summary of 22 major economies from around the world. For each country, we provide charts of local equity market prices, relative performance versus global equities, price to earnings ratios, dividend yields, economic growth, unemployment, retail sales and industrial production growth, inflation, money supply, spot FX performance versus the dollar, policy rate, and ten year local government bond yield interest rates. The report is intended as a tool for both reference and idea generation. It’s clients’ first stop for basic background info on how a given economy is performing, and what issues are driving the narrative for that economy. The dashboard helps you get up to speed on and keep track of the basics for the most important economies around the world, informing starting points for further research and risk management. It’s published weekly every Wednesday at the Bespoke Institutional membership level.
Click here to start a no-obligation two-week free trial to Bespoke Institutional!

B.I.G. Tips – Internationals Still Trouncing Domestics
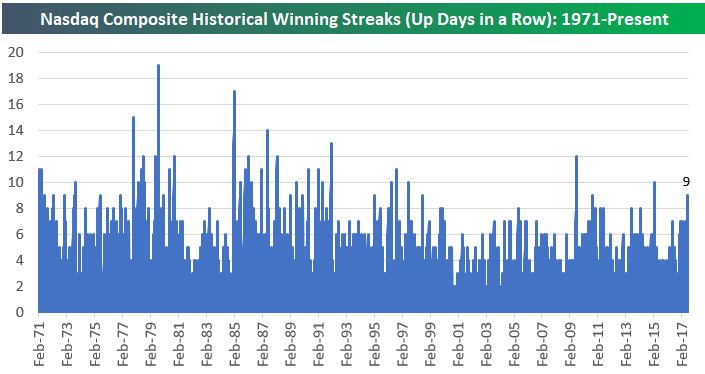
Nasdaq 9+ Day Winning Streaks
The Nasdaq Composite is set to close up for the 9th trading day in a row today. Below is a look at historical winning streaks for the index since its inception back in 1971.
Start a two-week free trial to Bespoke’s research platform to see our full offering.
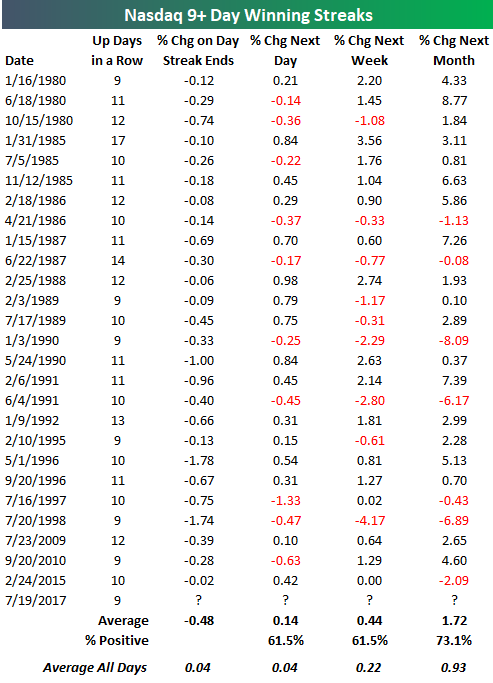
Below is a list of Nasdaq winning streaks of 9 days or longer throughout its history. For each streak, we highlight how the index performed in the days and weeks following the end of the streak as well.
As you’ll see at the bottom of the table, the index has done slightly better than average in the week and month after these long winning streaks have ended. So conventional wisdom that we might be due for a pause or pullback after a long winning streak does not really hold water.
The last winning streak of 9+ days for the Nasdaq came in February 2015 when it went up 10 trading days in a row. Following the end to that streak, the index did pullback 2% over the next month, however.
Fixed Income Weekly – 7/19/17
Searching for ways to better understand the fixed income space or looking for actionable ideals in this asset class? Bespoke’s Fixed Income Weekly provides an update on rates and credit every Wednesday. We start off with a fresh piece of analysis driven by what’s in the headlines or driving the market in a given week. We then provide charts of how US Treasury futures and rates are trading, before moving on to a summary of recent fixed income ETF performance, short-term interest rates including money market funds, and a trade idea. We summarize changes and recent developments for a variety of yield curves (UST, bund, Eurodollar, US breakeven inflation and Bespoke’s Global Yield Curve) before finishing with a review of recent UST yield curve changes, spread changes for major credit products and international bonds, and 1 year return profiles for a cross section of the fixed income world.
In this week’s note, we take a look at international investors’ purchases of US securities.
Our Fixed Income Weekly helps investors stay on top of fixed income markets and gain new perspective on the developments in interest rates. You can sign up for a Bespoke research trial below to see this week’s report and everything else Bespoke publishes free for the next two weeks!
Click here to start your no-obligation free Bespoke research trial now!
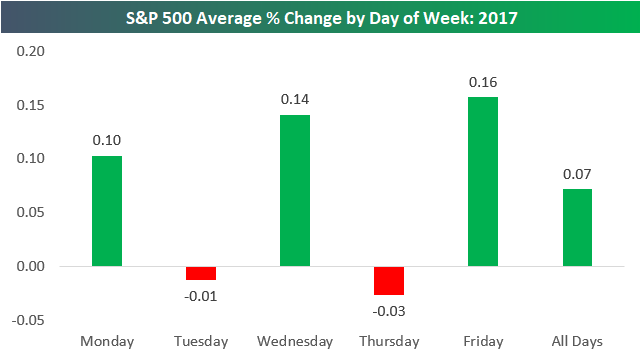
S&P 500 Average Change by Weekday
Below is an updated look at the performance of the S&P 500 by day of the week so far this year. For all trading days, the index has averaged a gain of 0.07% this year. But as shown below, the trading week has seen back and forth action between green and red. Mondays, Wednesdays, and Fridays have all averaged gains, with Wednesday posting stronger gains than Monday, and Friday posting stronger gains than Wednesday. In between, Tuesdays and Thursdays have both averaged slight declines. Go figure.
Start a two-week free trial to Bespoke’s research platform to see our full offering.