Bespoke’s Sector Snapshot — 8/24/17
We’ve just released our weekly Sector Snapshot report (see a sample here) for Bespoke Premium and Bespoke Institutional members. Please log-in here to view the report if you’re already a member. If you’re not yet a subscriber and would like to see the report, please start a 30-day trial to Bespoke Premium now.
Below is one of the many charts included in this week’s Sector Snapshot, which shows the S&P 500’s trailing 12-month P/E ratio over the last year. As you can see, the index’s P/E ratio has experienced contraction since the early part of 2017, which highlights the strength in earnings growth that we’ve seen.

To see our full Sector Snapshot with additional commentary plus six pages of charts that include analysis of valuations, breadth, technicals, and relative strength, start a 30-day free trial to our Bespoke Premium package now. Here’s a breakdown of the products you’ll receive.
B.I.G. Tips – Decile Analysis Since the 8/7 High
ETF Trends: Hedge – 8/24/17
Chart of the Day: Atlas Air Worldwide (AAWW)
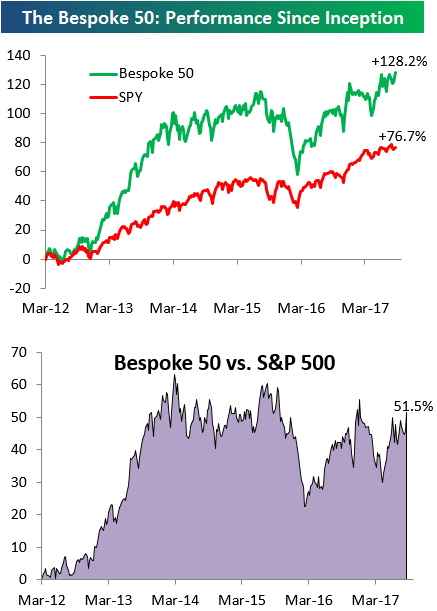
the Bespoke 50 — 8/24/17
Every Thursday, Bespoke publishes its “Bespoke 50” list of top growth stocks in the Russell 3,000. Our “Bespoke 50” portfolio is made up of the 50 stocks that fit a proprietary growth screen that we created a number of years ago. Since inception in early 2012, the “Bespoke 50” has beaten the S&P 500 by 51.5 percentage points. Through today, the “Bespoke 50” is up 128.2% since inception versus the S&P 500’s gain of 76.7%. Always remember, though, that past performance is no guarantee of future returns.
To view our “Bespoke 50” list of top growth stocks, sign up for Bespoke Premium ($99/month) at this checkout page and get your first month free. This is a great deal!
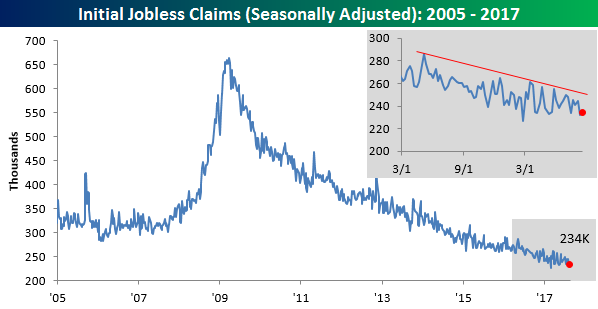
Another Week of Sub 250K Jobless Claims
It used to be that a weekly reading for initial jobless claims that came in below 300K was a big deal. Nowadays, sub-300K readings don’t even raise an eyebrow as the new 300K is 250K. In this week’s report, first-time jobless claims came in at 234K compared to estimates of 238K. Not only is that better than expected, but it also marks the 12th straight week that jobless claims have been at or below 250K. It’s hard to overstate just how impressive this trend is.
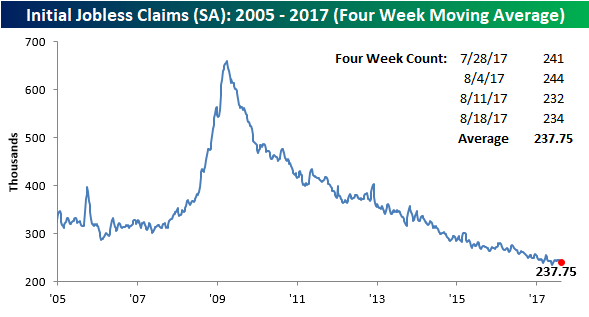
With this week’s second straight sub-240K print, the four-week moving average is also back below 240K and less than 3K from the cycle low of 235.5K made back in mid-May. While the 4-week average is close to a new low, in order to get there next week, we will have to see a print below 232K.
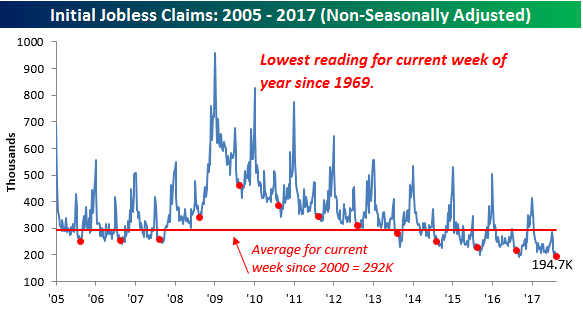
On a non-seasonally adjusted (NSA) basis, jobless claims were just as impressive dropping from 198.3K down to 194.7K. That’s the second straight week below 200K and is nearly 100K below the average level for the current week of the year since 2000. To find a week where the NSA reading for the current week of the year was lower, you have to go back to 1969.
Bulls Fading Into the Fall
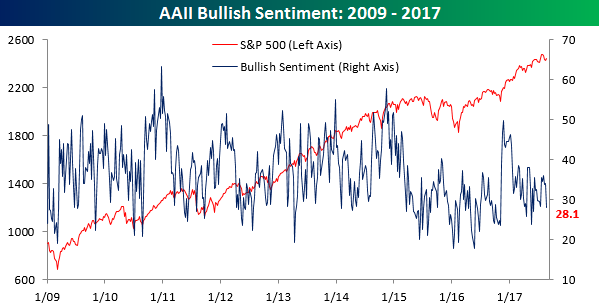
Based on the latest weekly sentiment data from AAII, it appears that investors are growing increasingly concerned about the market as bullish sentiment declined from an already low 34.17% down to 28.1%. That’s the lowest weekly reading since June 1st right before the volatility in the FANG stocks really got going and the largest weekly decline since mid-May. This week’s reading also extends the record streak of weeks below 50% up to 138 weeks!
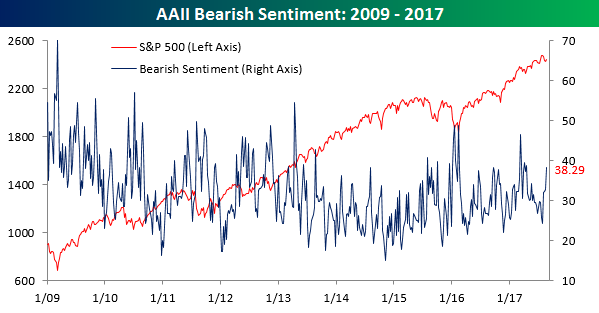
Bearish sentiment has seen an even more pronounced move, rising from 32.8% up to 38.29%. That’s the largest reading for the bearish camp since mid-April. Also outside of a few weeks in the Spring where bearish sentiment spiked higher, you have to go all the way back to early 2016 to find a period where bearish sentiment was higher.
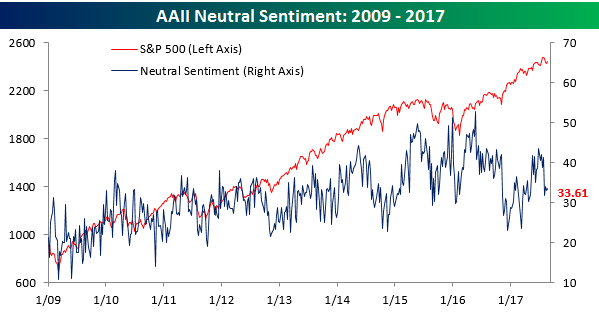
While individuals are increasingly bearish, one-third of investors still can’t make up their mind. While that may sound like a lot, it is actually down considerably from the 40%+ levels it was at just a few weeks ago.
The Closer — Hedging With Yen, Performance Spreads — 8/23/17
Log-in here if you’re a member with access to the Closer.
Looking for deeper insight on global markets and economics? In tonight’s Closer sent to Bespoke Institutional clients, we show the positive risk-adjusted return benefits of adding a single currency long to a 60/40 stock-bond portfolio. We also take a look at similar situations when a large spread has built up between the best and worst performing US equity indices. Finally, we review a weak new home sales print today.

The Closer is one of our most popular reports, and you can sign up for a free trial below to see it!
See today’s post-market Closer and everything else Bespoke publishes by starting a no-obligation 14-day free trial to our research platform!