ETF Trends: US Sectors & Groups – 7/25/17
Biotech has regained the form it showed for the last half of June and is back atop our list of best performing ETFs, up over 4% this week. Oil, Insurance, and Steel also made solid gains, joined by other notable outperformers Solar and Silver, which are both up around 2%. Natural Gas and Coffee are big losers this week, both down over 4% while no other ETFs fell more than 2%. Tranpsorts and Agriculture continue their recent downward trend as well. Rounding out our list of worst performers are Russia, Poland, and Energy.

Bespoke provides Bespoke Premium and Bespoke Institutional members with a daily ETF Trends report that highlights proprietary trend and timing scores for more than 200 widely followed ETFs across all asset classes. If you’re an ETF investor, this daily report is perfect. Sign up below to access today’s ETF Trends report.
See Bespoke’s full daily ETF Trends report by starting a no-obligation free trial to our premium research. Click here to sign up with just your name and email address.
Big Dow Outperformance
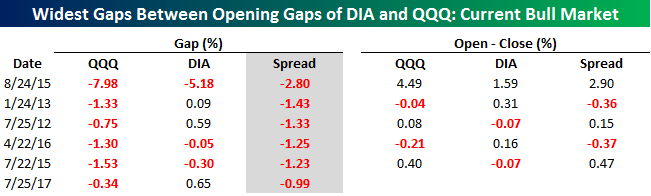
Thanks to some relatively disappointing earnings results from companies in the Tech sector (Alphabet-GOOGL and Seagate-STX) and positive results from Caterpillar (CAT) and McDonald’s (MCD), the Dow spiked higher at the open while the Nasdaq 100 opened lower. As a result of the divergence, the spread between the opening gap of DIA and QQQ was the sixth widest reading of the current bull market. The only other days where we saw a wider divergence are shown in the table below. Interestingly enough, one of those occurrences was exactly five years ago today! More importantly, though, all but one (8/24/15) of these occurrences came at the heart of various earnings seasons and suggests that moves like this are generally a short term phenomenon resulting from the flood of earnings reports rather than a sign of a longer term type of rotation.
Looking at the performance of both ETFs from the open to close on the five prior days shown below, there really hasn’t been much of a discernible trend where QQQ makes up for lost ground or DIA continues to run. In three of the five days, QQQ outperformed DIA from the open to close, while on the other two days DIA outperformed.
Click here to start a no-obligation two-week free trial to our premium research platform.
The Closer — Canadian Models, Euro Boost, And Mexican CPI — 7/24/17
Log-in here if you’re a member with access to the Closer.
Looking for deeper insight on global markets and economics? In tonight’s Closer sent to Bespoke Institutional clients, we take a look at GDP tracking in Canada and the “fair” value of the loonie, the impact of low EURUSD on relative performance for European manufacturing, and a review of CPI and gross value added data released in Mexico today.

The Closer is one of our most popular reports, and you can sign up for a free trial below to see it!
The Closer is one of our most popular reports, and you can see it and everything else Bespoke publishes by starting a no-obligation 14-day free trial to our research!
Little Enthusiasm for Earnings So Far
Best and Worst Performing Stocks on Earnings
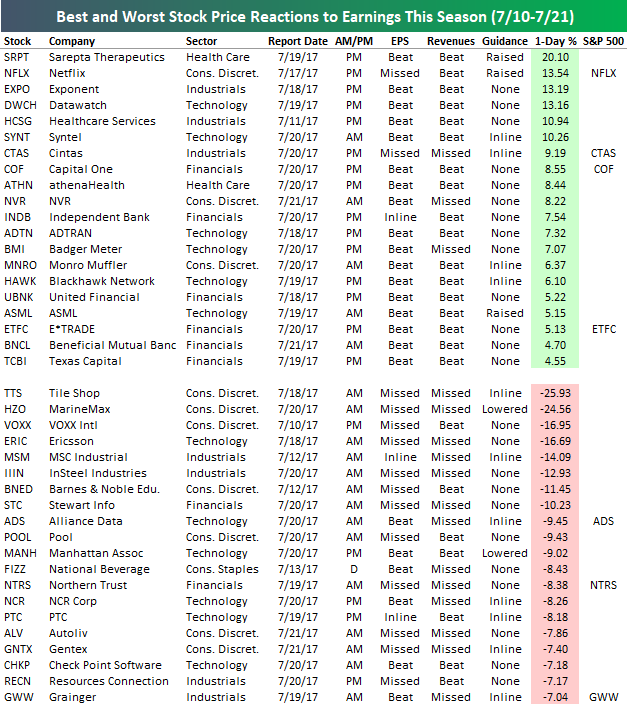
Below is a list of the 20 stocks that have gone up the most on their earnings reaction days so far this season. We also include a list of the 20 worst performers.
Sarepta Therapeutics (SRPT) has been the top performer so far this earnings season with a one-day gain of 20.1% (on 7/20/17). Netflix (NFLX) ranks second with a gain of 13.54%, followed by Exponent (EXPO), Datawatch (DWCH), and Healthcare Services (HCSG). Other notables on the list of winners include Capital One (COF), NVR, Monro Muffler (MNRO), and E*Trade (ETFC).
Tile Shop (TTS) has been the biggest loser this earnings season with a one-day drop of 25.93%. Just behind TTS is MarineMax (HZO), which fell 24.56% on 7/20 after it missed EPS estimates, missed revenue estimates, and guided lower. VOXX, Ericsson (ERIC), and MSC Industrials (MSM) round out the list of the top five losers.
Start a two-week free trial to Bespoke’s research platform to see more in-depth earnings season analysis.
B.I.G. Tips – CAT One Step Closer to Synchronous Growth
40 Largest Companies Set to Report This Week (7/24-7/28)
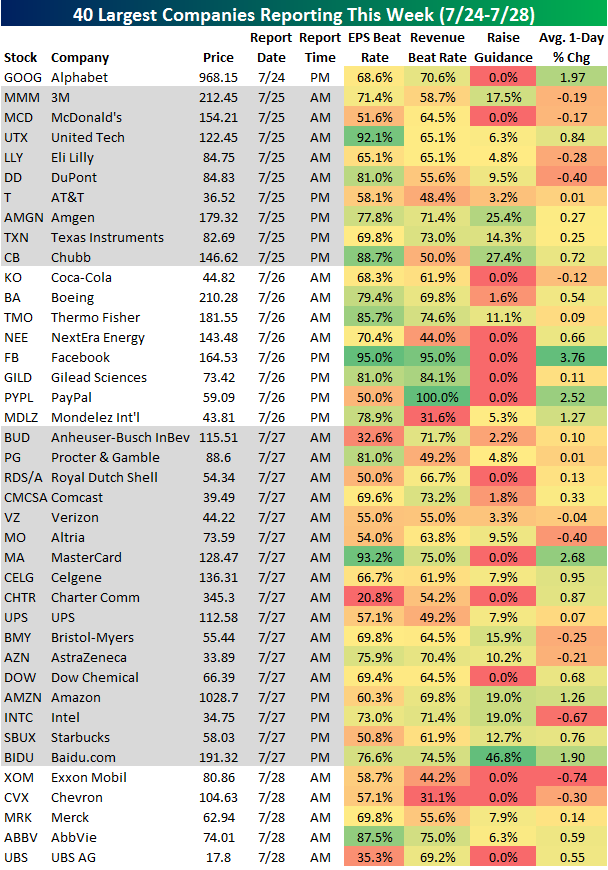
Below is a list of the 40 largest companies set to report earnings this week. Next to each company, we provide its historical beat rates (% of time beating analyst estimates) and its average one-day change on its earnings reaction days.
Alphabet (GOOGL) kicks things off for the large-cap space this evening when it reports after the close. As shown, GOOG has historically gained 1.97% on its earnings reaction day, so it goes up more often than not.
On Tuesday, we’ll hear from Dow 30 stocks like 3M (MMM), McDonald’s (MCD), and United Tech (UTX) in the morning, followed by AT&T (T), Amgen (AMGN), and Texas Instruments (TXN) after the close. Of the stocks reporting tomorrow, UTX beats EPS the most often and it also typically does the best in terms of price gains.
On Wednesday, Coca-Cola (KO) and Boeing (BA) report before the open, while Facebook (FB) will take over the tape after the close. Facebook (FB) has historically beaten both EPS and revenue estimates 95% of the time, and it has averaged a one-day change of +3.76% on its earnings reaction days.
Thursday is the busiest day for earnings this week by sheer volume, and the main company investors will be watching that day will be Amazon.com (AMZN) after the close.
Friday is the day for big-oil earnings, as both Exxon Mobil (XOM) and Chevron (CVX) will report before the open.
Start a two-week free trial to Bespoke’s research platform to see more in-depth earnings season analysis.
Bespoke Stock Seasonality – 7/24/17
ETF Trends: Hedge – 7/24/17
Solar maintains its strong performance among the universe of ETFs that we cover, being the only ETF up over 3% this week. Biotech has had a good week as well, responding well to a couple weeks of poor performance. Other notable outperformers include Silver, South Africa, and Gold. Meanwhile, Sweden and Natural Gas are the only ETFs down more than 3%. Oil and Transports continue to trend downward, along with other underperformers Germany, Russia, and Indonesia.

Bespoke provides Bespoke Premium and Bespoke Institutional members with a daily ETF Trends report that highlights proprietary trend and timing scores for more than 200 widely followed ETFs across all asset classes. If you’re an ETF investor, this daily report is perfect. Sign up below to access today’s ETF Trends report.
See Bespoke’s full daily ETF Trends report by starting a no-obligation free trial to our premium research. Click here to sign up with just your name and email address.
Bespoke Brunch Reads: 7/23/17
Welcome to Bespoke Brunch Reads — a linkfest of the favorite things we read over the past week. The links are mostly market related, but there are some other interesting subjects covered as well. We hope you enjoy the food for thought as a supplement to the research we provide you during the week.
See this week’s just-published Bespoke Report newsletter by starting a no-obligation two-week free trial to our premium research platform.
Announcements
Introducing The Reformed Broker All Access by Josh Brown (The Reformed Broker)
Ritholtz Wealth Management CEO and noted market commentator Josh Brown announces his plans for @AllAccessTRB, part of Premo Social, a new social media service from Bespoke. [Link]
Investing
Brokers’ Call on Wall Street: Bye by Michael Wursthorn (WSJ)
A review of the move from wirehouse offices where brokers charge commissions for trades to the independent registered investment advisor model. [Link; paywall]
Wall Street Profits by Putting Investors in the Slow Lane by Jonathan Macey and David Swensen (NYT)
Fractions of a cent per trade incentivized by rebates to brokers can add up to billions in costs at scale. More importantly, the practice isn’t transparent, limiting the steps customers can take to prevent or avoid it. [Link; soft paywall]
Goldman Partners Mark End of Era as Stock Holding Drops Below 5% by Dakin Cambell (Bloomberg)
When Goldman IPO’d in May of 1999, more than 60% of the firm’s value was held by partners. As of the third of July, that number is down to less than 5%, its lowest ever. [Link; auto-playing video]
Business Models
The Business of Artificial Intelligence by Erik Brynjolfsson and Andrew McAfee (HBR)
A fantastic and comprehensive overview of the current AI space and what the outlook looks like, struck in easy to understand and realistic terms. [Link]
The Crazy Math Behind Drug Prices by Paul Barrett and Robert Langreth (Bloomberg)
In the complex US healthcare system, pharmacy benefit managers stand between drug companies and the entities that pay for drugs, like insurance companies, are the subject of new lawsuits alleging harm to consumers by uncompetitive behavior. [Link]
International Affairs
EU threatens to escalate Article 7 action against Poland by Arthur Beesley (FT)
With Poland’s Law & Justice Party attacking the independence of the country’s supreme court, the EU is considering steps to limit the attack on an independent judiciary. [Link; paywall]
An Early Sign India’s Huge Tax Revamp Is Working: Happy Truck Drivers by Corinne Abrams, Debiprasad Nayak, and Anant Vijay Kala (WSJ)
Reform to India’s tax system has removed regional taxes and replaced it with a national GDP, improving efficiency of movement for goods around the massive country. [Link; paywall]
Can the Fed and ECB Work Together To Reduce Imbalances? by Brad W. Setser (Council on Foreign Relations)
An argument that the ECB should focus on raising interest rates rather than reducing its balance sheet, having an optimal impact on the country’s currency and the imbalances in global current accounts. [Link]
Economic Dynamism
Older and Slower: The Startup Deficit’s Lasting Effects on Aggregate Productivity Growth by Titan Alon, David Berger, and Robert Dent (NBER Working Papers)
A unique paper design that shows productivity declines are likely driven in large part by falling turnover of US firms, also called the “startup deficit”. [Link; 37 page PDF]
Low-Income Earners See Weekly Pay Gain Faster Than Other Groups by Eric Morath (WSJ)
Wages for the lowest paid workers (those in the bottom decile of usual weekly earnings) are growing at the fastest pace in almost a decade, and faster than both median and top decile workers. [Link; paywall]
Crime and Punishment
Forget Silk Road, Cops Just Scored Their Biggest Victory Against The Dark Web Drug Trade by Thomas Fox-Brewster (Forbes)
This week the DoJ announced cooperative actions with international law enforcement agencies which shut down two major clearinghouses for both cryptocurrency and illicit drugs. [Link]
Archana
Why Banco Popular’s credit default swaps are getting messy by Robert Smith (FT)
The ECB put a Spanish bank into liquidation last month, but CDS linked to junior debt are now facing uncertain payouts because junior bondholders may have legal claims related to the liquidation. [Link; paywall]
Real Estate
2017 Profile of International Activity in US Residential Real Estate (National Association of REALTORS)
An excellent, chart-heavy review of purchases made by international buyers in the US market. Total dollar volume reached $153.0 billion in the twelve months ended March 2017, close to evenly split between residents and non-residents. [Link; 48 page PDF]
Ouch
Former $2 billion private equity fund now nearly worthless: WSJ by Dion Rabouin (Reuters)
An oil producer-focused private equity fund raised at the peak of the shale boom has collapsed, with investor holdings now worth nothing. [Link]
Long Reads
A Piece of the Action: Recent Books on the Digital Economy by Ron Hogan (LA Review of Books)
Long, winding words on the imagination of the digital economy that ends with a brilliant metaphor for network effect products using an episode of Start Trek. [Link]
Screaming About Stocks Into A Well: A Text Adventure by Noon Six Capital (Medium)
A play on a recent McSweeney’s piece, Noon Six playfully expresses what so many investors are thinking: futility and frustration in a world that we just don’t always understand. [Link]
On The Lighter Side
Supreme Court’s Junior Justice Has to Run the Cafeteria. Don’t Eat There by Jess Bravin (WSJ)
An endearing review of the cafeteria which serves the Supreme Court and the hazing new members of the court undergo by operating it. [Link; paywall]
The 100 Greatest Props In Movie History, And The Stories Behind Them (Thrillist)
An exhaustive list of the physical tapestry of movies, complete with discussions from members of the production team and stories about how they came into being. [Link]
Have a great Sunday!