The Closer — Quarterly Consumer Data, Retail Sales — 8/15/17
Log-in here if you’re a member with access to the Closer.
Looking for deeper insight on global markets and economics? In tonight’s Closer sent to Bespoke Institutional clients, we chart the quarterly data contained in the New York Fed’s Consumer Credit panel, as well as reviewing retail sales today and introducing three new web-based tools for subscribers.

The Closer is one of our most popular reports, and you can sign up for a free trial below to see it!
See today’s post-market Closer and everything else Bespoke publishes by starting a no-obligation 14-day free trial to our research platform!
Bespoke Stock Scores: 8/15/17
Chart of the Day: ROBO
ETF Trends: US Indices & Styles – 8/15/17
Keep Track of Futures Positioning With The Closer
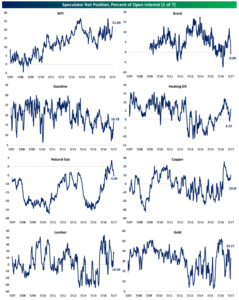
Each Friday in our post-market macro note — The Closer (available to Bespoke Institutional clients), we update tracking of futures market positioning using the CFTC’s Commitment of Traders report. We’ve created a handy table so that clients can analyze the data each week, where we show the net position of traders reporting as speculators relative to the size of the market (percentage of open interest) in a given futures contract.
Speculator shorts are deducted from speculator longs to give a “net” position. To summarize that positioning, the table below shows the current share of open interest (OI) along with the median, average, and ten year percentile. We also show the change over the last 1, 4, 12, and 52 weeks, and show the position relative to the 10-year average in standard deviations in the scatter plot to the right as well as the change over the last 12 weeks. The result is a comprehensive picture of how various asset classes are positioned.
Positioning can be a very helpful contrarian indicator; when financial speculators pile on to a rising price and become an unbalanced long, there’s nobody left to buy and prices are left vulnerable to a correction. This type of positioning is highlighted when the dots in our scatter plot move further and further into the green zone. The opposite is also true for futures markets with falling prices. When the dot in our scatter plot moves further and further left, speculators have become excessively bearish relative to history. While not comprehensive – because they ignore spot markets for financial and physical commodities – the CoT report is definitely a helpful pointer to how the market currently sits.
Sign up for a two-week free trial to our Bespoke Institutional package if you’d like access to our weekly futures market positioning data in The Closer.

In our Closer report, we also show 10 year charts of positioning for each market listed above. Below is a sample of one of these chart grids, showing Energy futures positioning along with Copper, Lumber, and Gold.
Sign up for a two-week free trial to our Bespoke Institutional package if you’d like access to our weekly futures market positioning data in The Closer.
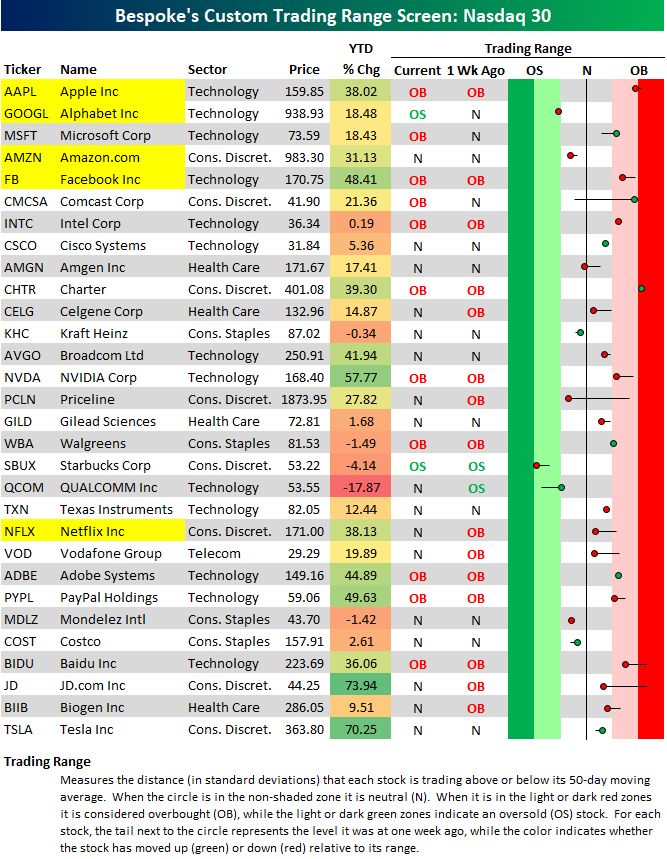
Bespoke’s FAANG+ Trading Range Screen
Below is an updated snapshot of our trading range screen ran on the 30 largest stocks in the Nasdaq 100. The list is sorted by market cap as of the end of Q2, and we’ve highlighted the much-hyped “FAANG” names in yellow. In the trading range section, the “OB” stands for “overbought,” and it happens when a stock trades more than 1 standard deviation above its 50-day moving average (the red zone). The “OS” stands for “oversold,” and that’s when the stock trades more than 1 standard deviation below the 50-day. “N” stands for “neutral,” which means the stock is trading between one standard deviation above and below its 50-day. The black vertical “N” line in the screen represents each stock’s 50-day moving average.
Of the thirty largest Nasdaq 100 stocks, eleven are currently trading in overbought territory, while just two are oversold (GOOGL and SBUX). Apple (AAPL), Comcast (CMCSA) and Charter (CHTR) are the most overbought names in the screen entering Tuesday’s trading day.
Start a 30-day free trial to Bespoke’s Premium service for our most actionable ideas.
The Closer — Toronto Home Prices, Fedspeak, Central Bank Doldrums, CoT Update — 8/14/17
Log-in here if you’re a member with access to the Closer.
Looking for deeper insight on global markets and economics? In tonight’s Closer sent to Bespoke Institutional clients, we review Canadian home price data released today, recent FOMC speeches, upcoming central bank meetings, and positioning recaps from the Commitment of Traders report released by the CFTC Friday.
The Closer is one of our most popular reports, and you can sign up for a free trial below to see it!
See today’s post-market Closer and everything else Bespoke publishes by starting a no-obligation 14-day free trial to our research platform!
Chart of the Day: Irrational Exuberance Indicator
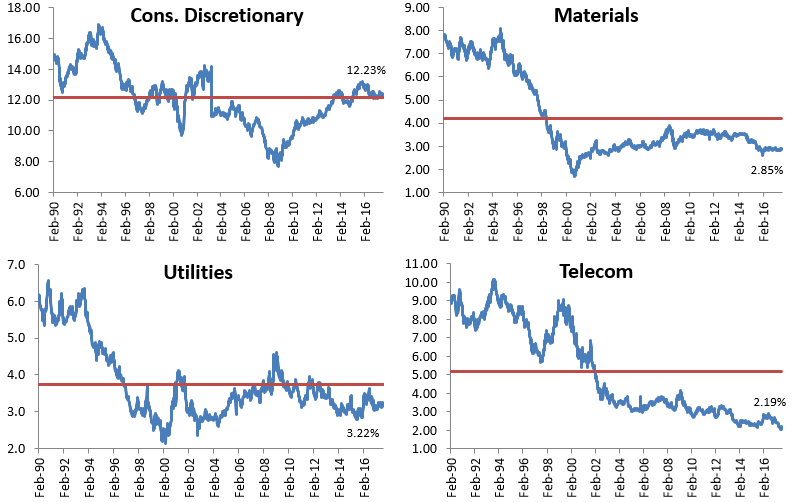
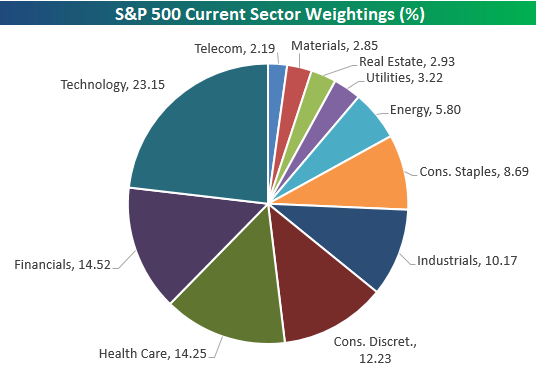
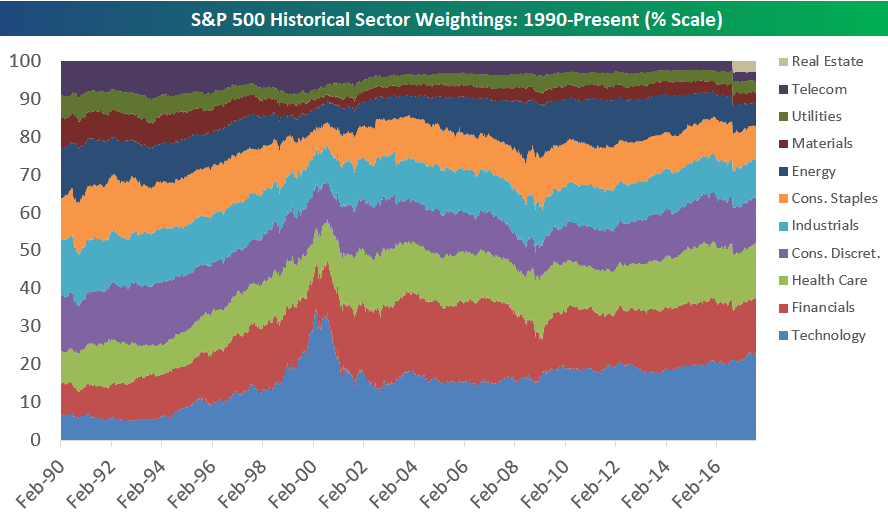
Updated 2017 S&P 500 Sector Weightings
Below is an updated look at where S&P 500 sector weightings stand as of August 14th, 2017. The Technology sector’s weighting remains above 23% at 23.15%. That’s just 22 basis points below its multi-year high of 23.37% set during the week of June 9th, 2017. Financials and Health Care are battling it out in second and third place with weightings of 14.52% and 14.25%, respectively.
Consumer Discretionary ranks fourth at 12.23%, Industrials is fifth at 10.17%, and Consumer Staples is sixth at 8.69%. Consumer Staples just dipped to its lowest weighting since March 2002!

Below is a look at S&P 500 sector weightings going back to 1990. This allows you to see how things have shifted over the years. In the early 90s prior to the Tech bubble, the economy was much more evenly distributed. In early 1990, Industrials was the largest sector of the market at 14.72%. That’s 8.5 percentage points below Tech’s weighting now. In 1990, Technology was actually the second smallest in the S&P 500 with a weighting of 6.34%! How times have changed.
The charts below break out the path of each sector’s S&P 500 weighting over time. The red line in each chart represents the sector’s average weighting over the entire time frame, so you can see which sectors are currently the furthest above or below their long-term averages. Technology and Health Care are the only two sectors currently well above their long-term averages. Consumer Staples, Energy, Industrials, Materials, Telecom and Utilities are all well below their long-term averages.