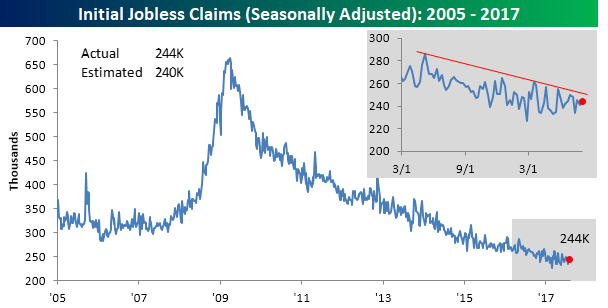
Jobless Claims Continue To Trend Lower
This week’s Initial Jobless Claims number came in at 232,000, which was the lowest print seen since the end of February (almost six months ago). As shown in the chart below, that makes it the second-lowest print of the current recovery and second-lowest since the 1970s despite huge expansion in population, labor force, and employment since then. Claims have been almost shockingly consistent in their declines for the last 6 years, with a nearly straight line down on the chart despite occasional short spikes higher.

The big drop in claims sequentially does a lot to flatten the 4 week moving average, which fell to 240.5k. It’s been lower a few times in recent memory and has definitely flattened out a bit, but it won’t take much over the next few weeks for it to keep dropping.

Disregarding the seasonal adjustment makes the weekly numbers look more impressive, not less. By our count, this is the lowest NSA initial jobless claims print for the current week of the year since the first year these statistics were kept. It’s drastically lower than the modern average for the current week and notably lower than prior weeks in this part of the calendar since 2000. Using claims as an indicator of labor market strength, it’s not hard to argue that the jobs picture continues to look excellent.
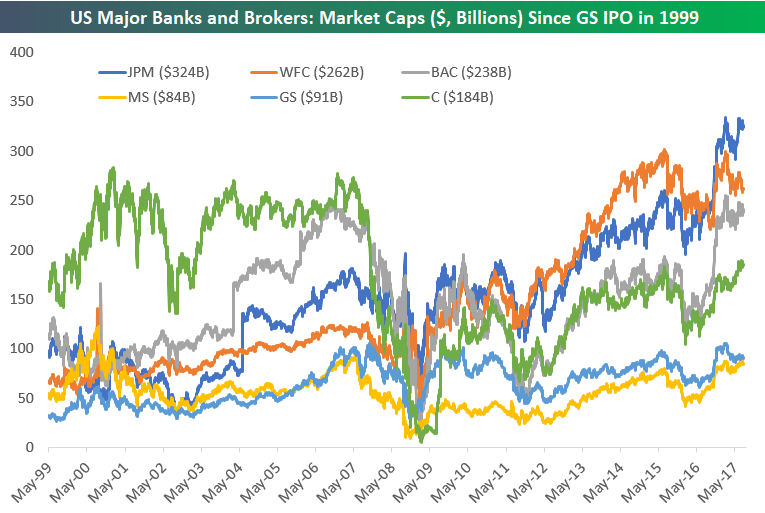
JP Morgan (JPM) Takes the Lead
Below is a look at the combined market cap of the six major US banks and brokers that we like to track — Goldman Sachs (GS), Morgan Stanley (MS), Wells Fargo (WFC), Bank of America (BAC), JP Morgan (JPM), and Citigroup (C). After dipping below $200 billion at the lows of the Financial Crisis back in early 2009, their combined market cap currently stands at roughly $1.2 trillion.

Looking at the market caps of the six individual companies, a lot has changed since the turn of the millennium. Goldman Sachs (GS) was the last to IPO of this group of six, so below is a chart showing the change in market caps for these stocks since Goldman’s IPO back in mid-1999.
Citigroup was on top in the early 2000s, and then Wells Fargo took a clear lead in the middle part of the current bull market. Now, though, it’s JP Morgan that has recently separated itself from the pack. At $324 billion, JPM has the highest market cap that any of these stocks have ever seen.
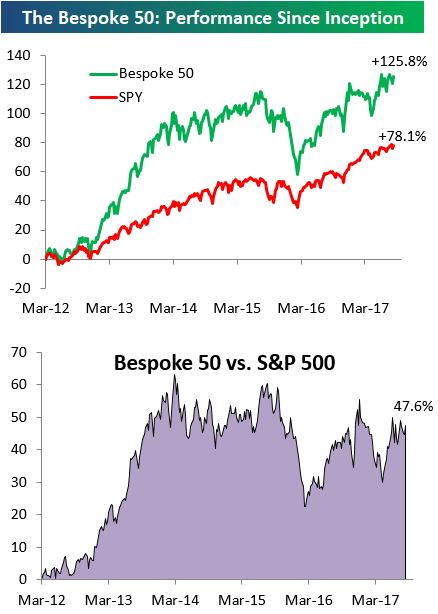
the Bespoke 50 — 8/17/17
Every Thursday, Bespoke publishes its “Bespoke 50” list of top growth stocks in the Russell 3,000. Our “Bespoke 50” portfolio is made up of the 50 stocks that fit a proprietary growth screen that we created a number of years ago. Since inception in early 2012, the “Bespoke 50” has beaten the S&P 500 by 47.6 percentage points. Through today, the “Bespoke 50” is up 125.8% since inception versus the S&P 500’s gain of 78.1%. Always remember, though, that past performance is no guarantee of future returns.
To view our “Bespoke 50” list of top growth stocks, sign up for Bespoke Premium ($99/month) at this checkout page and get your first month free. This is a great deal!
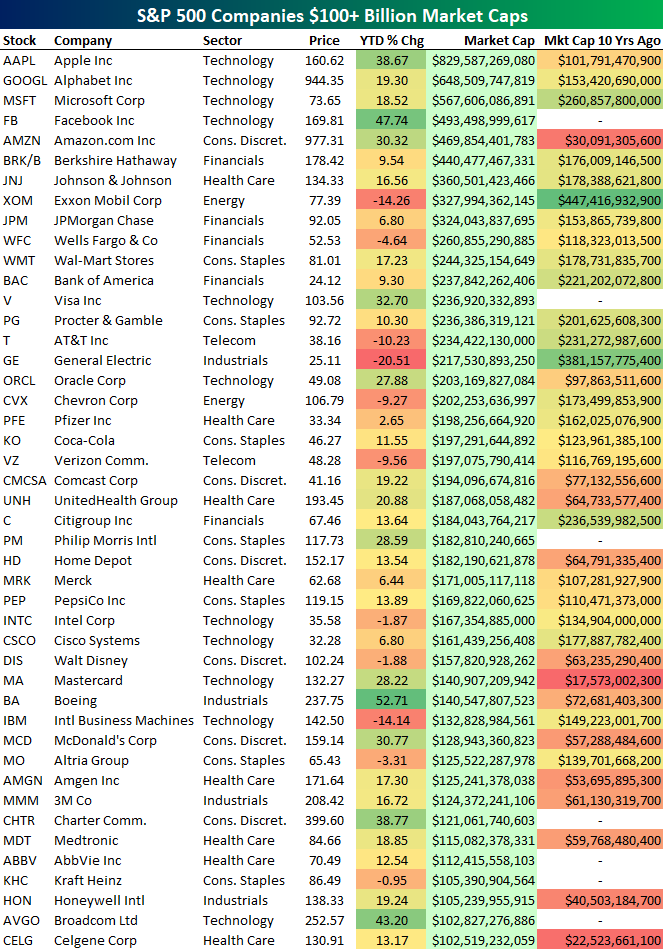
45 $100+ Billion Companies in the S&P 500
We were looking through charts today and noticed that Exxon Mobil (XOM) is completely breaking down. The drop has taken XOM’s market cap down to $328 billion, which ranks it as the 8th largest stock in the S&P 500. Below is a look at the 45 largest stocks in the index. These are the only stocks in the index with market caps above $100 billion as well.
Ten years ago, XOM was by far the largest stock in the world. Since then it has been overtaken by Apple (AAPL), Alphabet (GOOGL), Microsoft (MSFT), Facebook (FB), Amazon.com (AMZN), Berkshire (BRK/B), and Johnson & Johnson (JNJ). Even JP Morgan is creeping up on Exxon — it’s just $4 billion away.
The other company that has been lapped over the last ten years is General Electric (GE). Ten years ago it was the second largest stock in the S&P 500, but now it ranks 16th behind companies like Visa (V) and AT&T (T). A little bit more of a drop and Oracle will be larger than GE as well.
The point of this exercise is not so much to beat up on XOM and GE, but to try and help you recognize how much things can change in a ten-year span. A good number of the companies on this list had market caps of less than $50 billion back in August 2007, and now they’re mega-cap behemoths. Heck, Facebook (FB) wasn’t even public ten years ago, and now it’s the fourth largest company in the US.
While some of these companies will still be at or near the top of the list ten years from now, we can guarantee you that not all of them will. Instead, they’ll be replaced by the next Facebook, Amazon, or Apple. Anyone have a crystal ball we can borrow?
Start a 30-day free trial to Bespoke’s Premium service for our most actionable ideas.
The Closer — Multifamily Pain, Crude Drain, Fed-’splain — 8/16/17
Log-in here if you’re a member with access to the Closer.
Looking for deeper insight on global markets and economics? In tonight’s Closer sent to Bespoke Institutional clients, we review residential construction data from the US Census, recap weekly EIA data on the US petroleum market, and analyze the Fed minutes.

The Closer is one of our most popular reports, and you can sign up for a free trial below to see it!
See today’s post-market Closer and everything else Bespoke publishes by starting a no-obligation 14-day free trial to our research platform!
Chart of the Day: Breadth Weakens
ETF Trends: Hedge – 8/16/17
Fixed Income Weekly – 8/16/17
Searching for ways to better understand the fixed income space or looking for actionable ideals in this asset class? Bespoke’s Fixed Income Weekly provides an update on rates and credit every Wednesday. We start off with a fresh piece of analysis driven by what’s in the headlines or driving the market in a given week. We then provide charts of how US Treasury futures and rates are trading, before moving on to a summary of recent fixed income ETF performance, short-term interest rates including money market funds, and a trade idea. We summarize changes and recent developments for a variety of yield curves (UST, bund, Eurodollar, US breakeven inflation and Bespoke’s Global Yield Curve) before finishing with a review of recent UST yield curve changes, spread changes for major credit products and international bonds, and 1 year return profiles for a cross section of the fixed income world.
In this week’s note, we review the spike in corporate credit spreads and vol last week.
Our Fixed Income Weekly helps investors stay on top of fixed income markets and gain new perspective on the developments in interest rates. You can sign up for a Bespoke research trial below to see this week’s report and everything else Bespoke publishes free for the next two weeks!
Click here to start your no-obligation free Bespoke research trial now!
Bespoke’s Global Macro Report — 8/16/17
Bespoke’s Global Macro Dashboard is a high-level summary of 22 major economies from around the world. For each country, we provide charts of local equity market prices, relative performance versus global equities, price to earnings ratios, dividend yields, economic growth, unemployment, retail sales and industrial production growth, inflation, money supply, spot FX performance versus the dollar, policy rate, and ten year local government bond yield interest rates. The report is intended as a tool for both reference and idea generation. It’s clients’ first stop for basic background info on how a given economy is performing, and what issues are driving the narrative for that economy. The dashboard helps you get up to speed on and keep track of the basics for the most important economies around the world, informing starting points for further research and risk management. It’s published weekly every Wednesday at the Bespoke Institutional membership level.
Click here to start a no-obligation two-week free trial to Bespoke Institutional!

The Closer — Quarterly Consumer Data, Retail Sales — 8/15/17
Log-in here if you’re a member with access to the Closer.
Looking for deeper insight on global markets and economics? In tonight’s Closer sent to Bespoke Institutional clients, we chart the quarterly data contained in the New York Fed’s Consumer Credit panel, as well as reviewing retail sales today and introducing three new web-based tools for subscribers.
The Closer is one of our most popular reports, and you can sign up for a free trial below to see it!
See today’s post-market Closer and everything else Bespoke publishes by starting a no-obligation 14-day free trial to our research platform!