Bespoke’s S&P 500 Weekly Chart Book – 8/18/17
The Bespoke Report: Fall Is Coming
The Closer: End of Week Charts — 8/18/17
Looking for deeper insight on global markets and economics? In tonight’s Closer sent to Bespoke clients, we recap weekly price action in major asset classes, update economic surprise index data for major economies, chart the weekly Commitment of Traders report from the CFTC, and provide our normal nightly update on ETF performance, volume and price movers, and the Bespoke Market Timing Model. This week, we’ve added a section that helps break down momentum in developed market foreign exchange crosses.

The Closer is one of our most popular reports, and you can sign up for a free trial below to see it!
Click here to start your no-obligation two-week free Bespoke research trial now!
ETF Trends: International – 8/18/17
B.I.G. Tips – Streak of Days Without an Oversold Reading Set to End
The Closer — Autos And Authority Weaken — 8/17/17
Log-in here if you’re a member with access to the Closer.
Looking for deeper insight on global markets and economics? In tonight’s Closer sent to Bespoke Institutional clients, we review weakening industrial production data and the collapse in auto assemblies that drove it. We also take a look at the technical breakdown in US equity indices today, along with a review of the catalysts.
The Closer is one of our most popular reports, and you can sign up for a free trial below to see it!
See today’s post-market Closer and everything else Bespoke publishes by starting a no-obligation 14-day free trial to our research platform!
Bespoke’s Sector Snapshot — 8/17/17
We’ve just released our weekly Sector Snapshot report (see a sample here) for Bespoke Premium and Bespoke Institutional members. Please log-in here to view the report if you’re already a member. If you’re not yet a subscriber and would like to see the report, please start a 30-day trial to Bespoke Premium now.
Below is one of the many charts included in this week’s Sector Snapshot, which shows our trading range screen for the S&P 500 and ten sectors. The black vertical “N” line represents each sector’s 50-day moving average, and as you can see, the S&P and six sectors have moved below their 50-days.
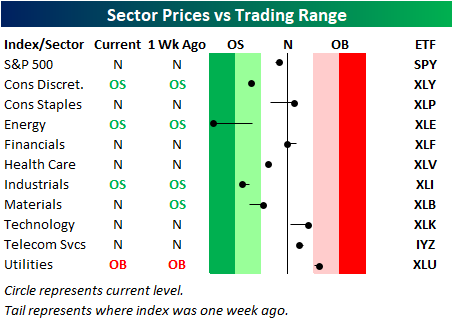
To see our full Sector Snapshot with additional commentary plus six pages of charts that include analysis of valuations, breadth, technicals, and relative strength, start a 30-day free trial to our Bespoke Premium package now. Here’s a breakdown of the products you’ll receive.
ETF Trends: US Sectors & Groups – 8/17/17
Chart of the Day: Packaging Corp of America (PKG)
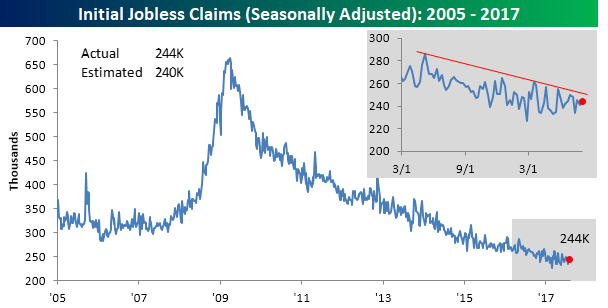
Jobless Claims Continue To Trend Lower
This week’s Initial Jobless Claims number came in at 232,000, which was the lowest print seen since the end of February (almost six months ago). As shown in the chart below, that makes it the second-lowest print of the current recovery and second-lowest since the 1970s despite huge expansion in population, labor force, and employment since then. Claims have been almost shockingly consistent in their declines for the last 6 years, with a nearly straight line down on the chart despite occasional short spikes higher.

The big drop in claims sequentially does a lot to flatten the 4 week moving average, which fell to 240.5k. It’s been lower a few times in recent memory and has definitely flattened out a bit, but it won’t take much over the next few weeks for it to keep dropping.

Disregarding the seasonal adjustment makes the weekly numbers look more impressive, not less. By our count, this is the lowest NSA initial jobless claims print for the current week of the year since the first year these statistics were kept. It’s drastically lower than the modern average for the current week and notably lower than prior weeks in this part of the calendar since 2000. Using claims as an indicator of labor market strength, it’s not hard to argue that the jobs picture continues to look excellent.