B.I.G. Tips – Newsletter Writers Are Bullish
Fixed Income Weekly – 1/4/17
Searching for ways to better understand the fixed income space or looking for actionable ideals in this asset class? Bespoke’s Fixed Income Weekly provides an update on rates and credit every Wednesday. We start off with a fresh piece of analysis driven by what’s in the headlines or driving the market in a given week. We then provide charts of how US Treasury futures and rates are trading, before moving on to a summary of recent fixed income ETF performance, short-term interest rates including money market funds, and a trade idea. We summarize changes and recent developments for a variety of yield curves (UST, bund, Eurodollar, US breakeven inflation and Bespoke’s Global Yield Curve) before finishing with a review of recent UST yield curve changes, spread changes for major credit products and international bonds, and 1 year return profiles for a cross section of the fixed income world.
In this week’s note, we take a look t the relationship between equity and high yield returns.
Our Fixed Income Weekly helps investors stay on top of fixed income markets and gain new perspective on the developments in interest rates. You can sign up for a Bespoke research trial below to see this week’s report and everything else Bespoke publishes free for the next two weeks!
Click here to start your no-obligation free Bespoke research trial now!
Chart of the Day: Losers Lead the Way
Dow 20,795
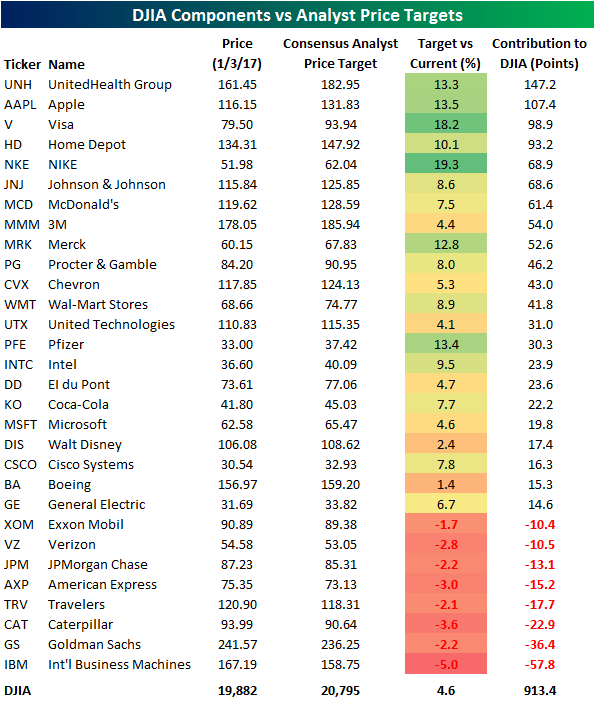
With investors, or maybe just the media more specifically, intensely focused on when the Dow Jones Industrial Average (DJIA) will finally break above 20,000, we wanted to see how analyst price targets for the 30 components of the index compare to current prices. Additionally, if each of the stocks in the index traded up to their respective consensus target, where would the index trade? Obviously, this is purely a theoretical exercise as not a lot of weight is put into specific price targets. That being said, where targets stand relative to current prices provides a gauge as to how bullish or bearish the analyst community is towards a specific stock, or in this case, the DJIA.
The table below lists each of the DJIA’s 30 components along with their consensus price target from the analyst community as well as how many points would be added to the index if the target was reached. With a consensus target of $182.95, analysts are expecting 13.3% upside for UnitedHealth (UNH). While three other stocks are expected see more upside based on their target prices in percentage terms, because of its higher share price and the fact that the index is price-weighted, if UNH rallies to its target price it would add nearly 150 points to the overall index. Behind UNH, the only other stock that would contribute more than 100 points to the DJIA if its target was reached would be Apple (AAPL), with analysts expecting 13.5% of upside. The stock that analysts are the most bullish on is NIKE (NKE). With a current target of $62.04, analysts expect nearly 20% upside from the stock, but because of its relatively low share price, that would translate to just under 70 DJIA points.
Analysts are usually tilted to the bullish side, but there are eight stocks in the DJIA where the consensus target is actually lower than the current price. At a level of $158.75, IBM’s consensus target is 5% below where it closed yesterday. Likewise, for Goldman (GS), it closed yesterday 2.2% above its consensus target. Ever since November, GS has been a big contributor to the DJIA’s gain, but if you put any weight into price targets, other stocks are going to have to start taking the lead in order for the DJIA to break above 20K.
Combining all the price targets for the 30 stocks, analyst price targets currently imply 913 points of upside for the DJIA relative to yesterday’s close, which would take the index up to 20,795 (a 4.6% gain). For a group that is usually associated with rose-colored glasses, analysts that cover the 30 stocks in the DJIA aren’t really all that bullish right now.
Like what you see? Click here to gain full access to Bespoke and our 2017 outlook report.
A December to Remember for Ford Truck Sales
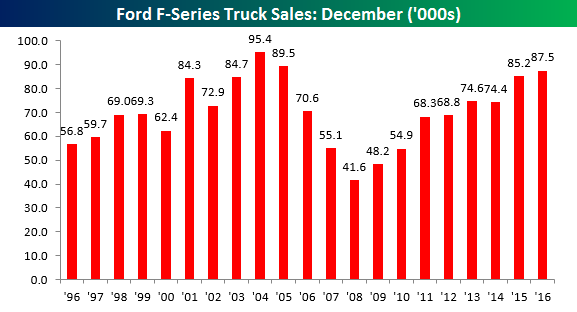
Forget about Lexus. It was definitely a “December to Remember” for sales of Ford F-Series trucks. While we have been updating our running total of all US car sales for December over here, Ford sold a lot of F-Series trucks in December. While the figures below aren’t adjusted for selling days, we would note that total sales of F-Series trucks in December came in at 87.5K, which is the best month of December for Ford F-Series sales since 2005 and the third best December in the last 20 years.
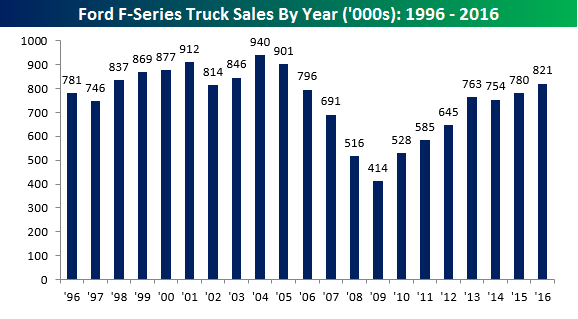
With December’s strong showing, total sales of F-Series trucks came in just shy of 821K in 2016, which was also the best year for total sales since 2005. While everyone knows that sentiment has improved since the election, it has also translated into sales of F-Series trucks as 159.6K were sold in the last two months of the year. The only other year where the last two months of the year saw a higher sales total was in 1996 (161.9K).
Like what you see? Click here to gain full access to Bespoke and our 2017 outlook report.
Auto Sales On Pace For New Expansion High Early in December Reporting
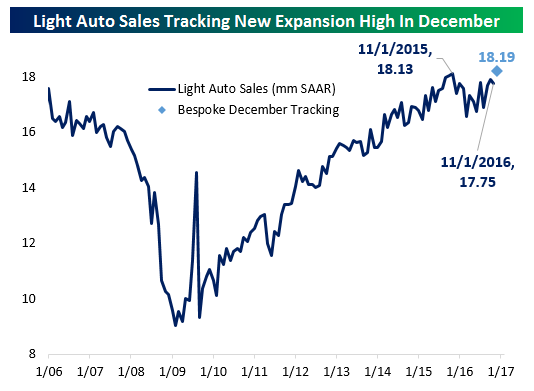
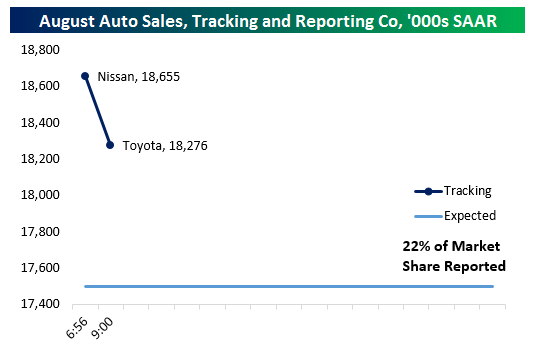
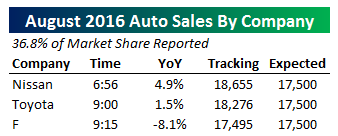 We’ve only got reports from three major US automakers and that equates to 41% of the industry reported but with those figures December looks to have been a strong month for US auto sales. With Nissan, GM, and Ford reported, we’re tracking a sales pace north of 18.9mm on a seasonally adjusted, annual rate basis. That sales pace is not likely to be matched by every other reporting company, but as things stand currently the industry is on pace to exceed the November, 2015 peak sales rate of 18.13mm SAAR. As shown at right, all three reporting companies saw higher sales on a YoY basis which does not adjust for seasonality or trading days. Analysts had been expecting both Nissan and Ford to record NSA YoY declines. The current 18.9mm SAAR pace we’re tracking is nearly 1.2mm SAAR better than analyst expectations. As usual, we’ll continue to update both the table at right and charts below throughout the day as more companies report.
Update 1 10:52 AM: With 70% of the market reported across six manufacturers (including the four largest: Toyota, GM, Ford, and Fiat-Chrysler) December auto sales are still tracking a healthy beat versus estimated sales of 17.7mm SAAR and 17.75mm SAAR last month. However, they’re much at the current pace we’re tracking than the booming 19mm sales pace suggested by the early reports from Nissan and GM. One huge winner on the day that wouldn’t have been easy predict earlier this year: Volkswagen. Sales are up over 20% YoY as the company recovers from its emissions scandal.
Update 2 11:52 AM: We’ve seen a few more small manufacturers report since our last updated and with a bit more than 73% of them market reported we’re now up to 18.23mm SAAR on our tracker. Strong gains from Audi YoY pushed sales there up by over 13% from a year ago while declines for Mazda were smaller than estimated.
Update 3 1:43 PM: Since our last update we’ve gotten reports from Honda, Porsche, Mitsubishi, BMW, Kia and Subaru, representing another 20% of the total US auto market. We’ve now got reports from over 93% of the market with only Mercedes and Hyundai outstanding. Subaru continued to gain market share with an impressive year-over-year double-digit sales improvement. Honda also delivered a strong report. On net, there’s been a little improvement in the tracker since the last update and auto sales look set to reach 18.23mm per our math. As a reminder, that’s better than the 18.13mm SAAR recorded in November of last year. That month is the current high water mark for the current expansion. While we won’t see the explosion higher in sales that we were tracking after strong Nissan and GM reports, December looks to be a solid month and a new expansion high nonetheless.
Final Update 3:23 PM: As shown below, with 99% of the market reported, auto sales made a new expansion high in the month of December. As indicated in the table above right, Wards Auto has a slightly higher estimate. Either way, however, the previous 18.13mm highwater mark from 13 months ago has now fallen. That’s significantly stronger than the 17.7mm SAAR estimated by economists entering reporting today.
The Closer – 1/3/17 – PMIs Much Improved
Log-in here if you’re a member with access to the Closer.
Looking for deeper insight on global markets and economics? In tonight’s Closer sent to Bespoke Institutional clients, we take a look at some of the major Manufacturing PMI readings for December.
The Closer is one of our most popular reports, and you can see it and everything else Bespoke publishes by starting a no-obligation 14-day free trial to our research!
Stock Seasonality Report: 1/3/17
Chart of the Day – Poor Technicals For Emerging Markets
Economic Data Kicks Off 2017 on a Positive Note
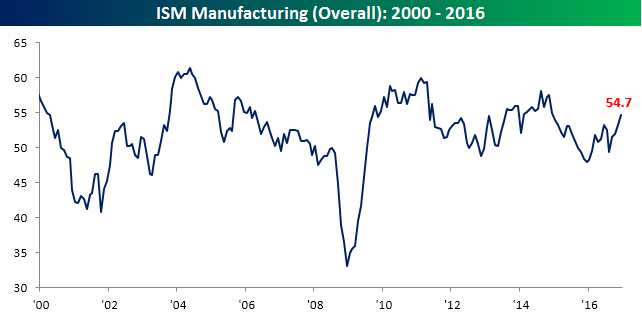
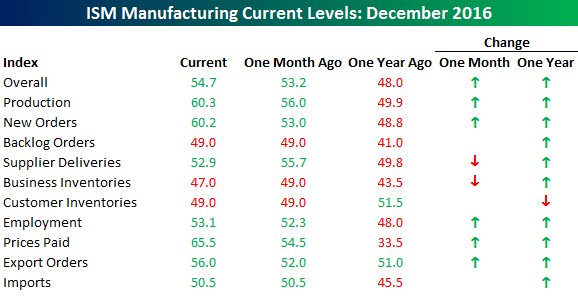
While it has been a relatively quiet US economic calendar to kick off the New Year, the data we did get was better than expected. The most notable of them all was the ISM Manufacturing report for the month of December. Economists were expecting a headline reading of 53.8, but the actual reading came in notably higher at 54.7, which was the highest level in exactly two years.
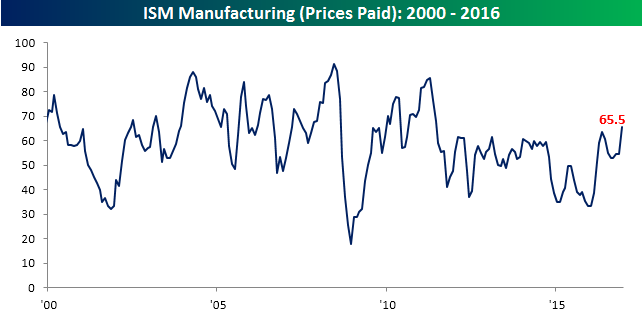
Not only was the headline reading strong, but the internals were also mostly to the upside. On a month/month basis, just two components declined, while on a year/year basis only one component declined. The biggest gainers this month were Prices Paid, New Orders, and Production. In the case of Prices Paid, that index rose 11 points to 65.5, which was the highest monthly reading since June 2011 (chart below). While the 11-point increase was large, we saw an even larger one-month increase back in March when the Prices Paid component surged 13 points.
Like what you see? Click here to gain full access to Bespoke and our 2017 outlook report.

