B.I.G. Tips – Strong ISM: As Good As it Gets?
Chart of the Day: Winners and Losers of 2017
The Most Volatile Month of the Year
While it has historically been positive, October has the distinction of being known as the most volatile month of the year. What that means in a year where volatility has been non-existent remains to be seen, but if the market was going to become more unsettled at some point, history says that now is the time. Today, we wanted to show two examples of how volatility tends to spike during October. In terms of the S&P 500’s average intra-month range, going back to 1928, the percentage spread between its closing high and low during the month of October has been a staggering 8.30%. That’s more than 1.3 percentage points above the next highest month (November – 7.0%). After October and November, though, volatility really recedes with an average spread of only 5.26% in December.
Gain access to 1 month of any of Bespoke’s premium membership levels for $1!
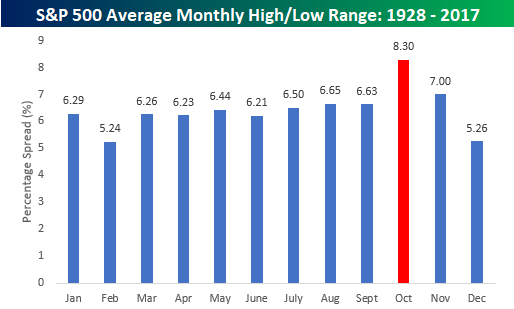
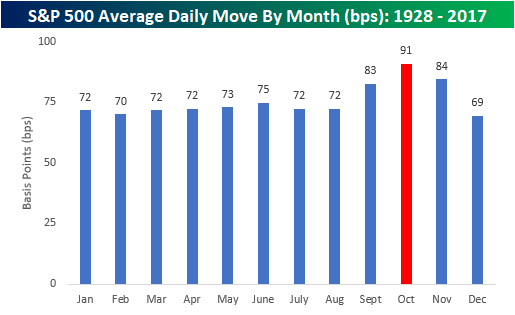
As shown in the chart above, February and December tend to have the smallest intra-month ranges, but February also has the fewest amount of trading days as well, so that skews things. Another way to look at monthly volatility on a more apples to apples basis is by measuring the index’s average daily percentage move (up or down) during each trading day of the month. Using this approach, the picture is very similar; volatility tends to pick up in September, October, and November and then fades in December to close out the year. Once again, October sees the largest average daily percentage move at 91 basis points (bps). In other words, the S&P 500 has historically averaged moves of close to +/-1% on trading days throughout the month of October. The key difference between this chart and the one above is that on this basis volatility in February is right inline with the other first eight months of the year. In fact, it’s pretty striking how average daily volatility tends to be so uniform for the first eight months of the year before going haywire in the final third.
Gain access to 1 month of any of Bespoke’s premium membership levels for $1!
2017 YTD Performance of the 40 Largest Stocks
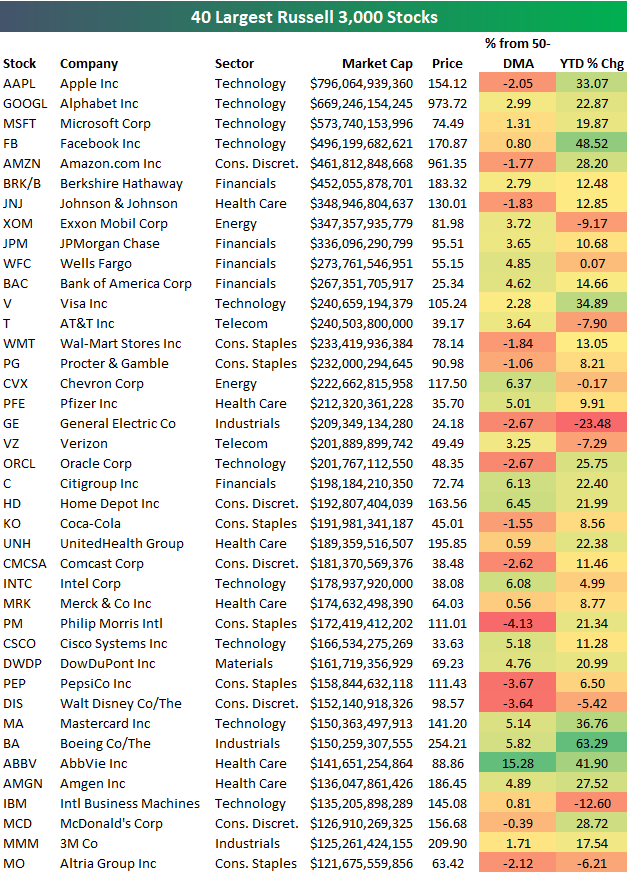
Below is a look at the year-to-date performance of the 40 largest stocks in the US through the end of the third quarter. As shown, the five biggest companies are all Tech related (even though AMZN is categorized as Consumer Discretionary), and they’re all up 19% or more year-to-date. Of the five largest stocks, Facebook (FB) is up the most this year with a gain of 48.52%.
While Facebook is up the most of the five largest stocks, Boeing (BA) is up the most of the stocks listed with a YTD gain of 63%. General Electric (GE) is the worst performer with a YTD decline of 23.48%.
Gain access to 1 month of any of Bespoke’s premium membership levels for $1!
ISM Manufacturing Report in a Word – Strong
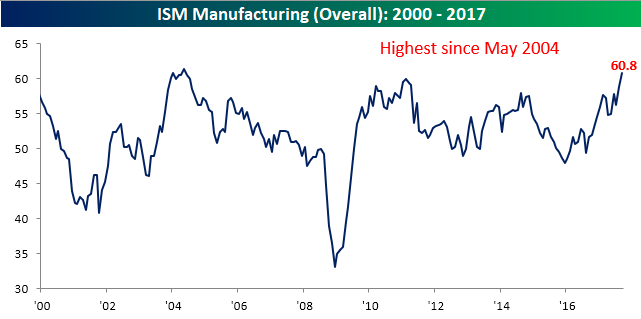
The ISM Manufacturing report for the month of September came in significantly ahead of expectations, topping 60 for the first time in over 13 years. While economists were forecasting the headline index to come in at a level of 58.1, the actual reading came in at 60.8. Relative to expectations, September’s report was the strongest since October 2014, and on an absolute level, this month’s print was the highest since May 2014.
Gain access to 1 month of any of Bespoke’s premium membership levels for $1!
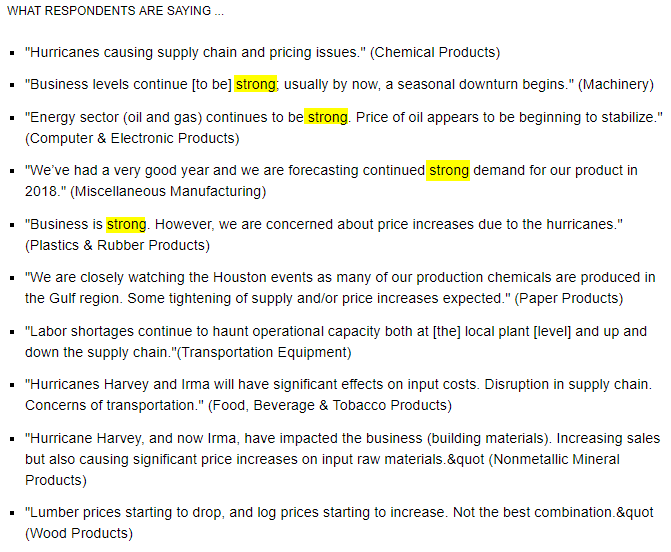
Looking at the commentary of each month’s report helps to get an idea of what issues manufacturers face, and besides the short-term disruption caused by the hurricanes, one word that stands out is “strong.”
The table below shows the m/m and y/y changes in the headline ISM Manufacturing index and each of its subcomponents. On a m/m basis, the only components that declined this month were Business Inventories and Imports. On the upside, the biggest increases were in Prices Paid, Supplier Deliveries, and New Orders. Year/year, Customer Inventories was the only component that declined.
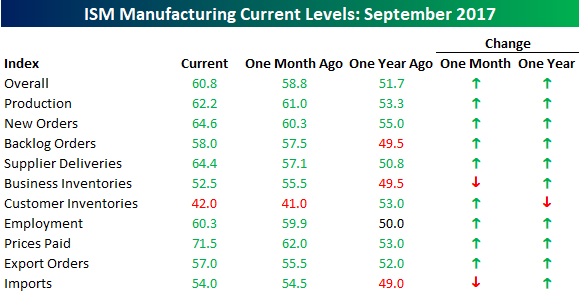
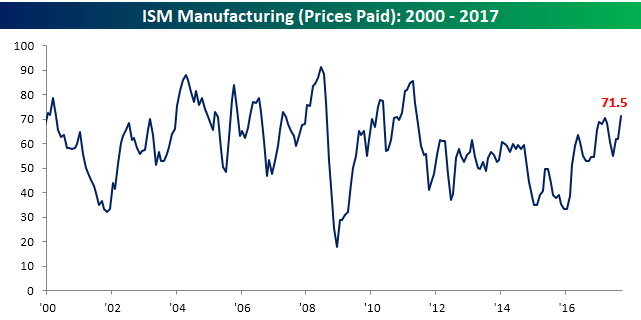
In terms of Prices Paid, this month’s increase was notable as the 9.5 point increase brought that index up to its highest level since May 2011.
Gain access to 1 month of any of Bespoke’s premium membership levels for $1!
Best Performing Stocks YTD Through Q3 2017
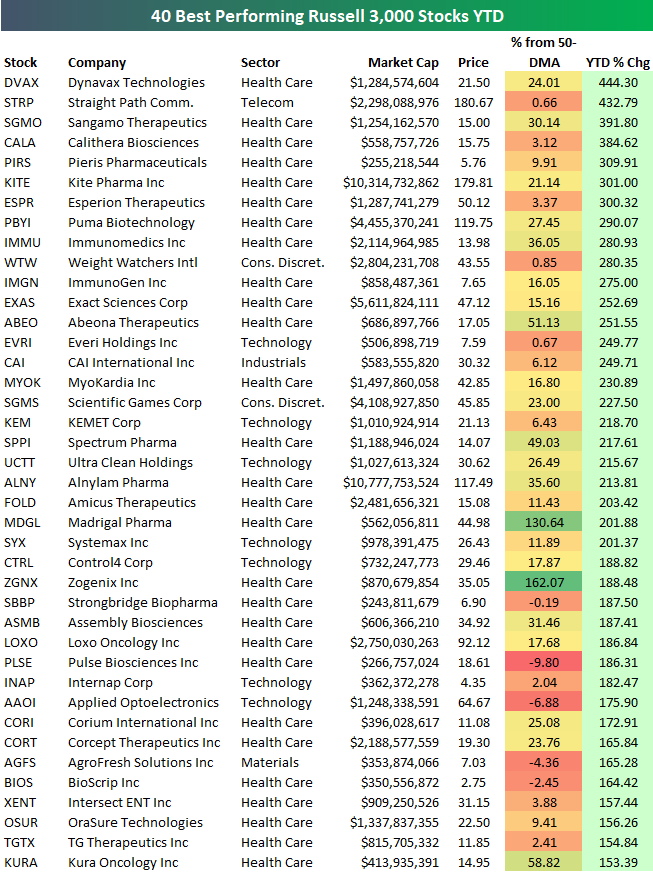
Below is a list of the 40 best performing Russell 3,000 stocks on a year-to-date basis through the third quarter of 2017. You’ll notice that a bulk of the names on the list of biggest winners are from the Biotech space. Dynavax Tech (DVAX) ranks first with a YTD gain of 444%. Straight Path (STRP) ranks second at +432.79% but it’s in the process of getting acquired after a bidding war for the company’s valuable sprectrum. Sangamo Therapeutics (SGMO), Calithera Biosciences (CALA), and Pieris Pharma (PIRS) round out the top five. Eight of the top nine are Biotech stocks, and then Weight Watchers (WTW) ranks tenth with a gain of 280%.
Gain access to 1 month of any of Bespoke’s premium membership levels for $1!
Because so many Biotech companies top the list of winners this year, below is a list of the 40 best performing non-Biotech names in the Russell 3,000. There are 8 companies listed that are up more than 200% year-to-date, including Everi (EVRI), CAI Intl (CAI), Scientific Games (SGMS), and Ultra Clean (UCTT). Other notables on the list include Control4 (CTRL), Lumber Liquidators (LL), Cutera (CUTR), LendingTree (TREE), National Beverage (FIZZ), and Square (SQ). If you have some time this week, browse through these names to see what the back-story is behind the big outperformance this year.

Bespoke Stock Seasonality Report: 10/2/17
Bespoke Brunch Reads: 10/1/17
Welcome to Bespoke Brunch Reads — a linkfest of the favorite things we read over the past week. The links are mostly market related, but there are some other interesting subjects covered as well. We hope you enjoy the food for thought as a supplement to the research we provide you during the week.
See this week’s just-published Bespoke Report newsletter by starting a no-obligation two-week free trial to our premium research platform.
Investing
Meet Wall Street’s New King Makers: the ETF Strategists by Asjylyn Loder (WSJ)
With centrally managed portfolios of ETFs becoming more common, cross-market impacts can often be tied back to single decisions makers allocating huge volumes of cash. [Link; paywall]
Clean Energy
London summit 2017: Breaking Clean by Michael Liebreich (Bloomberg New Energy Finance)
Don’t be scared off by the daunting page count – many of these slides have only a few words and it’s a much quick read than you might expect at 170+ pages. Liebreich gives an excellent recap of where non-carbon energy has come from, and where it’s going, including some downright hilarious pessimism about the growth of installed capacity from forecasters. [Link; 171 page PDF]
What’s Old Is New Again
The History of Sears Predicts Nearly Everything Amazon Is Doing by Derek Thompson (The Atlantic)
While Amazon’s ethos seethes disruption and innovation, it’s taking a truly remarkable number of pages from the playbook of Sears, the first American company to offer ubiquitous home delivery. [Link]
The Oil Ghost Towns of Texas by Dan Murtaugh (Bloomberg)
West Texas has been home to booms and busts in the oil industry since oil was first discovered in the region and the current crop of busts is part of that long heritage. [Link]
Economics
Labor Market Outcomes in Metropolitan and Non-Metropolitan Areas: Signs of Growing Disparities by Alison Weingarden (FEDS Notes)
Part of a growing focus on distributional growth analysis, this paper does an excellent job analyzing the disparities between large metros and rural metros in terms of employment and wages. [Link]
Demographic Transition and Low U.S. Interest Rates by Carlos Carvalho, Andrea Ferrero, and Fernanda Nechio (FRBSF Economic Letter)
An econometric analysis of the impact of low population rates and an aging population on the real neutral rate of interest. [Link]
An Inflation Expectations Experiment by Carola Binder (Quantitative Ease)
Do consumers’ unrealistically high inflation expectations respond to priming by seeing charts of actual inflation rates or learning about the Fed’s 2% target? Indisputably, yes. [Link]
Asia
The IMF’s China Problem by Brad W. Setser (Council On Foreign Relations)
The macro imbalances of China (excessive credit growth, a huge fiscal deficit) should result in a very high current account deficit, but the absurd savings rate in China (~46% of GDP) means that the 1% current account surplus would be roughly 4-5x as high without imprudent domestic policies. The real problem is not China’s current account surplus: it’s the savings rate. [Link]
The Lamps are Going Out in Asia by Joseph Dethomas (38 North)
We acknowledge this column is somewhat alarmist, but still think the logic it uses is worth considering and should be read: the current North Korean situation really does look like the summer of 1914 in Europe in many ways. [Link]
Productivity
Study: Women with more children are more productive at work by Ylan Q. Mui (WaPo)
St. Louis Fed researchers show in a recent paper that working economists with children are much more productive than their peers (as measured by output of papers). [Link; soft paywall]
Politics
Trump’s State-Tax Plan Could Cause Headaches for 52 Republican Lawmakers by Sahil Kapur (Bloomberg)
With Senate rules limiting the scale of budget impact for tax cuts wanted by GOP lawmakers, they’re forced to find pay-fors and have targeted the state and local tax deduction. Only problem? That deduction splits the Republican caucus badly in the House, where a unified front is needed to pass the package without Democrats. [Link]
Have a great Sunday!
The Bespoke Report – Everyone Gets a Trophy!
With two new closing highs this week, and a total of nine in September, the new closing highs for the S&P 500 are really starting to pile up. Year to date, there have now been 39 closing highs, which puts the index on pace for 52 new closing highs on the year. The last time we saw more was in 2014, but before that you have to go back to 1995 when there were 77. In the index’s history, there have only been more than 50 closing all-time highs four other times (1961, 1964, 1995, and 2014). That’s some impressive company!
If you’d like to read our thoughts on recent performance plus our outlook for the rest of the year, check out our weekly Bespoke Report. Sign up for a month to any of Bespoke’s premium membership levels for just $1!

With the third quarter coming to an end today, earlier today we did a post updating our asset class performance matrix using key ETFs traded on US exchanges. This is a great way to quickly see how various asset classes are performing on a total return basis. Looking through the performance figures, one thing that is hard to find is losers! Year to date, only five of the 58 ETFs in the matrix were down, and in Q3 just four were down. Call us crazy, but with everything seemingly winning, is the market starting to resemble kids little league?
If you’d like to read our thoughts on recent performance plus our outlook for the rest of the year, check out our weekly Bespoke Report. Sign up for a month to any of Bespoke’s premium membership levels for just $1!
Have a great weekend!
The Closer: End of Week Charts — 9/29/17
Looking for deeper insight on global markets and economics? In tonight’s Closer sent to Bespoke clients, we recap weekly price action in major asset classes, update economic surprise index data for major economies, chart the weekly Commitment of Traders report from the CFTC, and provide our normal nightly update on ETF performance, volume and price movers, and the Bespoke Market Timing Model. This week, we’ve added a section that helps break down momentum in developed market foreign exchange crosses.

The Closer is one of our most popular reports, and you can sign up for a free trial below to see it!
See tonight’s Closer by joining Bespoke Institutional at our special $1 introductory rate!