ETF Trends: US Sectors & Groups – 10/3/17
Bespoke Stock Scores: 10/3/17
NXP Semiconductors Better Alone?
It has been a year now since rumors first started circulating about QUALCOMM’s (QCOM) interest in NXP Semiconductors (NXPI), and more than eleven months since the $110 per share takeover was officially announced. Since that time, we have published a number of notes for clients (two examples are here and here) discussing how through a combination of the performance of the semiconductor stocks and the breakup fee agreed upon in the original merger agreement, that NXPI shareholders would likely be better off if the deal didn’t go through. For starters, if for some reason QCOM can’t close the deal because of regulatory or financial issues, the company would be required to pay NXPI a breakup fee of $2 billion. With 330 million shares outstanding, that breakup fee works out to about $6 per share or 5% of NXPI’s current market cap.
The second and bigger reason NXPI shareholders may be happy to see the deal fall apart is due to the performance of semiconductor stocks themselves since the deal was announced. The first chart below compares NXPI to the Philadelphia Semiconductor Index (SOX) since the start of July 2016. Leading up to the merger announcement, NXPI generally tracked the SOX index pretty closely. While the stock initially spiked and was outperforming its peer group immediately after the deal was announced, it started underperforming shortly thereafter and has continued to do so ever since. As of today, NXPI is up 45% since the start of July 2016, but the SOX index has gained 73%!
Gain access to 1 month of any of Bespoke’s premium membership levels for $1!
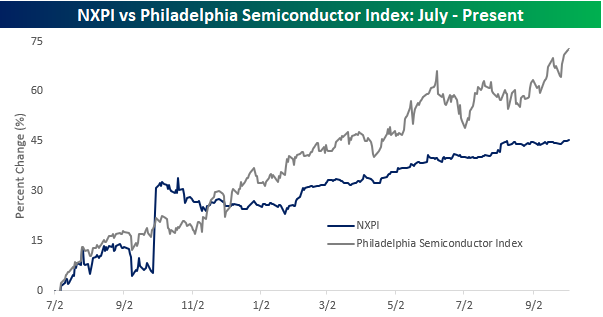
So how does that translate into stock prices? In the chart below we have plotted the price of NXPI along with where it would be trading had it simply matched the performance of the SOX index from 8/1/16 on. While NXPI has rallied 34.7% to $113.3 if it had performed inline with the SOX index, it would be trading at $134.6 today. Now obviously, that’s a counterfactual, but even before taking the potential $2 billion breakup fee into account, one could easily make the argument that with the original takeover price of $110 per share still in place and NXPI trading above $113, the biggest risk for NXPI shareholders now is that the previously agreed upon deal with QCOM actually does go through!
Gain access to 1 month of any of Bespoke’s premium membership levels for $1!

B.I.G. Tips – The Most Loved and Hated Sectors – October 2017
Blowout Truck Sales At Ford
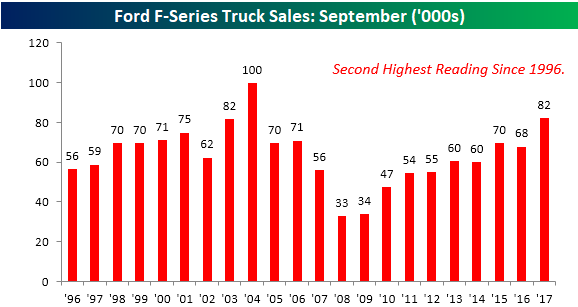
Whether or not the strength has been aided by the loss of the existing fleet due to the hurricanes in the South, auto sales for the month of September have absolutely been on fire. That strength in sales has been evident in truck sales too. We like to track sales of pickup trucks (specifically at Ford) as they are often a sign of strength or weakness in the small business and construction sectors, and based on these numbers from Ford, the small business sector looks strong. In the month of September, total F-Series truck sales at Ford totaled 82.3K. As shown in the chart below, that qualifies as the second strongest September sales total of F-Series trucks for Ford since at least 1996, trailing only September 2004 when total sales were 99.7K.
Gain access to 1 month of any of Bespoke’s premium membership levels for $1!
With this year’s strong September, total YTD sales of F-Series trucks from Ford now total 658.6K. That’s more than 10% above the YTD total through last year at this time and is the fourth highest YTD total through September dating back to 1996. The only years where the YTD run rate was stronger were 2004 (698K), 2005 (695K), and 2000 (683K).
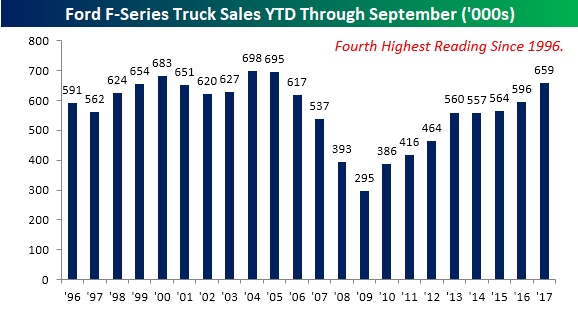
Chart of the Day: Bank Breakout
The Closer — Powerful Market Indicator? — 10/2/17
Log-in here if you’re a member with access to the Closer.
Looking for deeper insight on global markets and economics? In tonight’s Closer sent to Bespoke Institutional clients, we discuss the surge in ISM Manufacturing for the month of September reported today. We also take a look at the rising spread between ISM and Markit PMIs and the soft level of construction spending in the US.

The Closer is one of our most popular reports, and you can sign up for a free trial below to see it!
See today’s post-market Closer and everything else Bespoke publishes by starting a no-obligation 14-day free trial to our research platform!