The Bespoke Report — 9/1/17
The Closer: End of Week Charts — 9/1/17
Looking for deeper insight on global markets and economics? In tonight’s Closer sent to Bespoke clients, we recap weekly price action in major asset classes, update economic surprise index data for major economies, chart the weekly Commitment of Traders report from the CFTC, and provide our normal nightly update on ETF performance, volume and price movers, and the Bespoke Market Timing Model. This week, we’ve added a section that helps break down momentum in developed market foreign exchange crosses.

The Closer is one of our most popular reports, and you can sign up for a free trial below to see it!
Click here to start your no-obligation two-week free Bespoke research trial now!
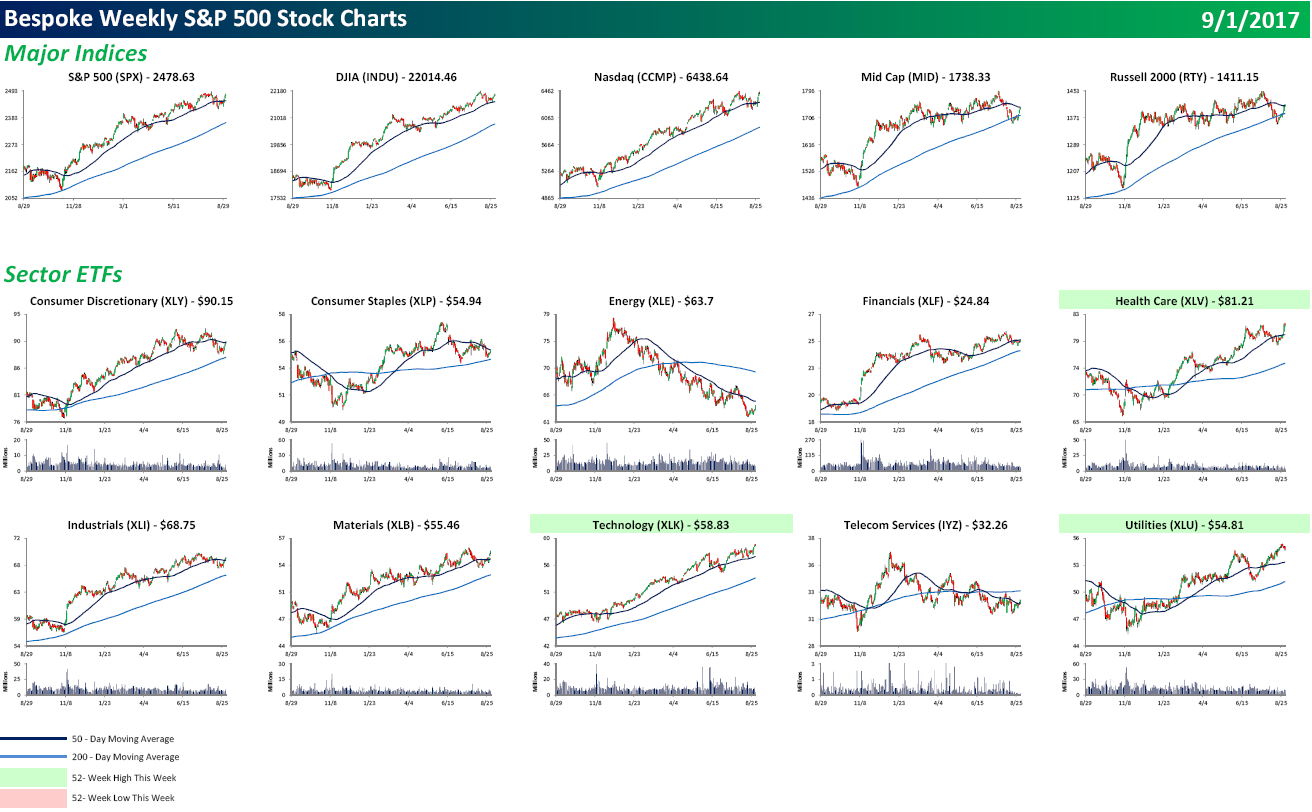
S&P 500 Quickview Chartbook — 9/1/17
Each weekend as part of our Bespoke Premium and Institutional research service, clients receive our S&P 500 Quick-View Chart Book, which includes one-year price charts of every stock in the S&P 500. You can literally scan through this report in a matter of minutes or hours, but either way, you will come out ahead knowing which stocks, or groups of stocks, are leading and lagging the market. The report is a great resource for both traders and investors alike. Below, we show the front page of this week’s report which contains price charts of the major averages and ten major sectors.
To see this week’s entire S&P 500 Chart Book, sign up for a 14-day free trial to our Bespoke Premium research service.
ETF Trends: US Sectors & Groups – 9/1/17
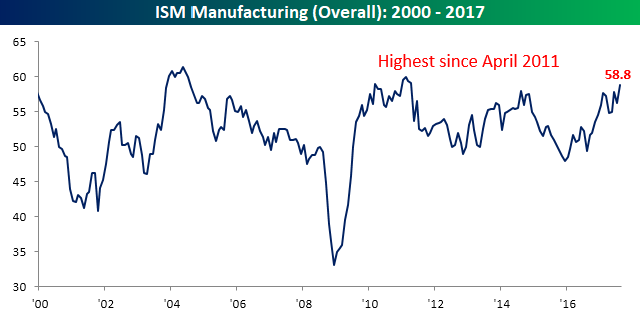
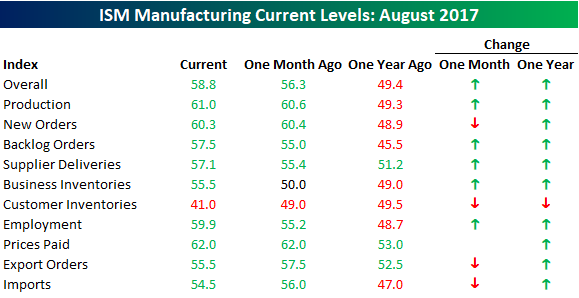
ISM Manufacturing Sizzles
The weather may be cooling off, but today’s ISM Manufacturing report for August came in hot. While economists were expecting the headline reading to come in at a level of 56.5, the actual reading came in at 58.8. That’s the highest reading since April 2011! It may not be the largest share of the US economy, but the manufacturing sector is on fire.
Summer may be ending, but that means you can take advantage of our Labor Day Special and receive a month of full access to any one of our research services for just $1 and then 20% off for the life of the subscription!
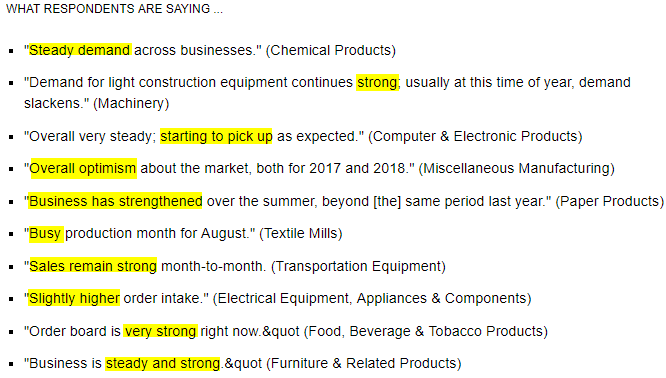
The commentary in this month’s report was even stronger than the numbers. Below we show the “What Respondents Are Saying” section from the ISM report, and all the adjectives are positive.
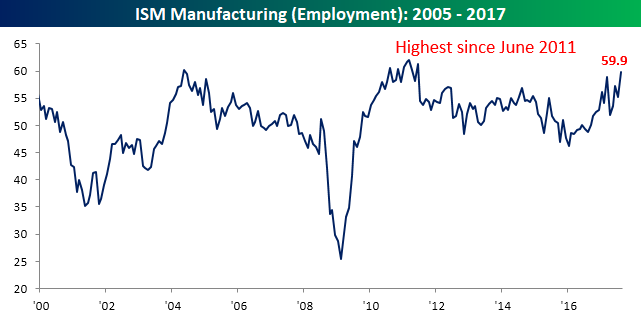
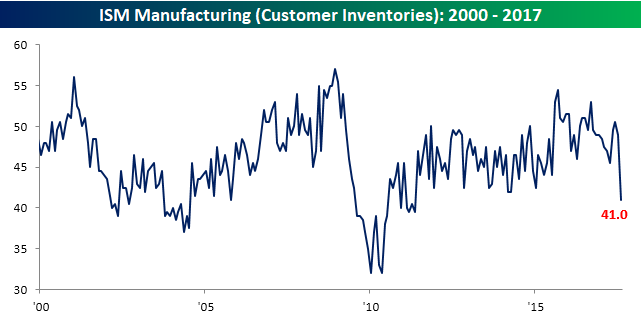
Among the report’s sub-components, on both a month-over-month and year-on-year basis, breadth was strong. Relative to July, five components were stronger while four declined. One of the highlights this month was Employment, which spiked to its highest level since June 2011 (chart below). While the monthly employment report for August was weaker than expected, that component’s strength in the ISM report helps to offset that weakness. On a y/y basis, the only component that declined was Customer Inventories. At a level of 41.0, that component is now at its lowest level since April 2011 (chart below).
Ford Truck Sales Strong
There hasn’t been a lot of good news in the auto sector lately, but today’s August results from Ford (F) weren’t as bad as expected. Overall, Ford vehicle sales were down 2.3% during the month compared to expectations for a larger decline of 3.5%. One particular bright spot for Ford was in its sales of F-series trucks which increased 15% over last August’s total. Keep in mind that these are unadjusted numbers that don’t take into account the number of selling days, but regardless, it was the fourth strongest August for F-Series sales going back to 1996 as well as the best August since 2005.
Summer may be ending, but that means you can take advantage of our Labor Day Special and receive a month of full access to any one of our research services for just $1 and then 20% off for the life of the subscription!
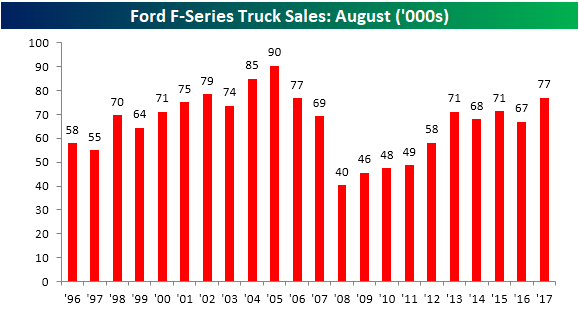
With August’s strong results, total F-Series sales for the year now stand at 576.33K. That’s also the strongest YTD reading through August since 2005 and the fifth best YTD reading through August going all the way back to 1996. We like to track sales of pickup trucks (specifically at Ford) as they are often a sign of strength or weakness in the small business and construction sectors, and based on these numbers from Ford, the small business sector looks strong.

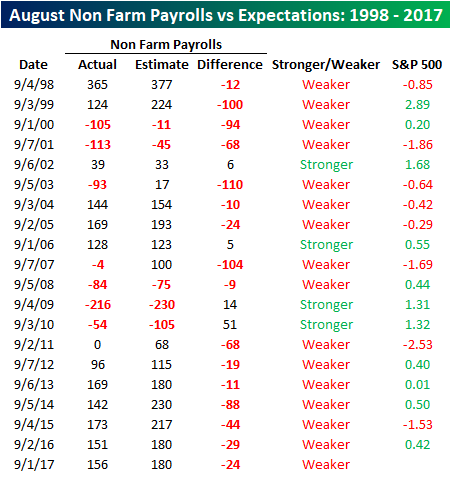
Non Farm Payrolls End of Summer Blues
It must be something about the end of Summer, but as we noted in our employment report preview yesterday, economists have historically done a horrible job predicting the change in Non-Farm Payrolls for the month of August. Using our Economic Indicator Database, which is available to all Bespoke Institutional clients, we screened for every Non-Farm Payrolls report dating back to 1998 to see how the initial report came in relative to expectations. As shown in the table below, the initial print of the August report has come in weaker than expected in sixteen of the last twenty years, and the average spread between the actual first reported number and the consensus estimate was a miss of 37K. Based on the average, you could argue that this month’s 24K miss was a good print on a relative basis!
Summer may be ending, but that means you can take advantage of our Labor Day Special and receive a month of full access to any one of our research services for just $1 and then 20% off for the life of the subscription!
The Closer — Failing Inflation — 8/31/17
Log-in here if you’re a member with access to the Closer.
Looking for deeper insight on global markets and economics? In tonight’s Closer sent to Bespoke Institutional clients, we take a look at today’s personal income and spending report, focusing on weakening inflation. We also review strong Canadian GDP from today and two PMI reports on manufacturing from the last 24 hours.
The Closer is one of our most popular reports, and you can sign up for a free trial below to see it!
See today’s post-market Closer and everything else Bespoke publishes by starting a no-obligation 14-day free trial to our research platform!
Bespoke’s Sector Snapshot — 8/31/17
We’ve just released our weekly Sector Snapshot report (see a sample here) for Bespoke Premium and Bespoke Institutional members. Please log-in here to view the report if you’re already a member. If you’re not yet a subscriber and would like to see the report, please start a 30-day trial to Bespoke Premium now.
Below is one of the many charts included in this week’s Sector Snapshot, which shows our trading range screen for the S&P 500 and ten major sectors. The dot represents where each sector is currently trading, while the tail end represents where it was trading one week ago. The black vertical “N” line represents each sector’s 50-day moving average. Moves into the red zone are considered “overbought,” while moves into the green zone are considered “oversold.”
As you can see, the S&P 500 and three sectors have moved into overbought territory as we end the month of August. Health Care has had by far the strongest move higher over the past week.

To see our full Sector Snapshot with additional commentary plus six pages of charts that include analysis of valuations, breadth, technicals, and relative strength, start a 30-day free trial to our Bespoke Premium package now. Here’s a breakdown of the products you’ll receive.
B.I.G. Tips – August Employment Report Preview
Heading into Friday’s Non-Farm Payrolls (NFP) report for August, economists are expecting an increase in payrolls of 180K, which would be a 29K decline from last month’s stronger than expected reading of 209K. In the private sector, economists are expecting a slightly smaller increase of 172K, which would represent a similar decline as the headline number. The unemployment rate is forecasted to remain at an exceptionally low level of 4.3%. Growth in average hourly earnings is expected to decelerate to 0.2%, while average weekly hours worked is also forecast to remain unchanged at 34.5.

Ahead of the report, we just published our eleven-page monthly preview for the August jobs report. This report contains a ton of analysis related to how the equity market has historically reacted to the monthly jobs report, as well as how secondary employment-related indicators we track looked in August. We also include a breakdown of how the initial reading for August typically comes in relative to expectations and how that ranks versus other months.
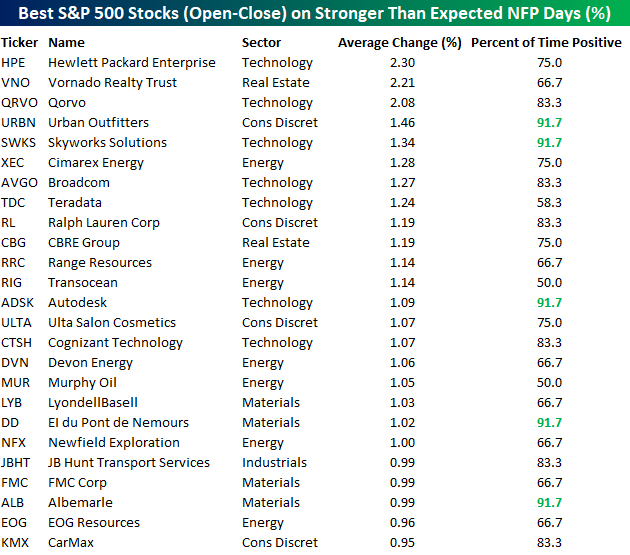
One topic we cover in each month’s report is the S&P 500 stocks that do best and worst from the open to close on the day of the employment report based on whether or not the report comes in stronger or weaker than expected. In other words, which stocks should you buy, and which should you avoid? The table below highlights the best-performing stocks in the S&P 500 from the open to close on days when the Non-Farm Payrolls report has been better than expected over the last two years. Of the 25 top performing stocks, seven sectors are represented, and Technology leads the way with seven. One of the top performing and consistently positive stocks on these days is Qorvo (QRVO) which has seen an average gain of 2.28% with positive returns 90% of the time.
For anyone with more than a passing interest in how equities are impacted by economic data, this report is a must read. To see the report, sign up for a monthly Bespoke Premium membership now!