
Bespoke’s Morning Lineup – 6/29/26 – Rebounding After An Unusual Week
See what’s driving market performance around the world in today’s Morning Lineup. Bespoke’s Morning Lineup is the best way to start your trading day. Read it now by starting a two-week trial to Bespoke Premium. CLICK HERE to learn more and start your trial.
“Real men despise battle, but will never run from it.” – George Washington

Below is a snippet of commentary from today’s Morning Lineup. Start a two-week trial to Bespoke Premium to view the full report.
After an unusual week where the S&P 500 traded lower every day but market breadth remained positive, leaving the average S&P 500 stock up 0.20%, investors are heading into the short week looking to push the indices higher. The S&P 500 is priced to open 0.8% higher, while the Nasdaq is poised to gain more than 1%. Investors will be watching mega-caps and memory stocks, which both came under pressure late last week, to see if they can get back on track.
Treasury yields are little changed, while oil trades up over 1% to $70 per barrel. Regarding oil, it could be worse as the US and Iran lobbed strikes at each other over the weekend but have since agreed to pause any strikes ahead of talks tomorrow. Gold prices are down about 1% while Bitcoin rallies just over 2% and moves back above $60K.
In Asia, it was a relatively quiet start to the week relative to recent trading. The Nikkei rallied 0.2% while South Korea fell 0.2%. Chinese stocks saw a little more action, rallying more than 1%. In Europe, stocks are mostly lower, but the losses have been modest. The STOXX 600 is down only 0.1% while France and the UK lead the losses with a decline of 0.4%.
In the US today, there’s not much data, but later in the week, we’ll have several key economic reports capped off with the June employment report on Thursday. In earnings news, some of the reports to focus on will be AeroVironment (AVAV) after today’s close and Constellation Brands (STZ) and Nike (NKE) after the close tomorrow.
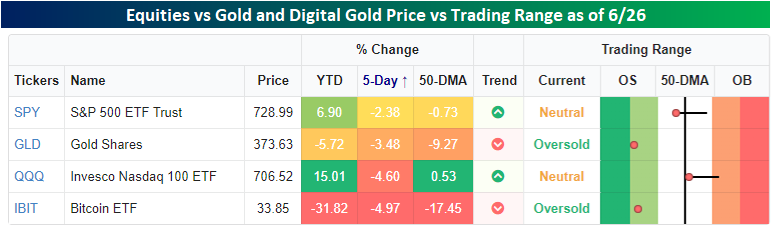
As bad a week as it was for the S&P 500 last week, it was even worse for both physical gold and its digital cousin (Bitcoin). Physical gold, as measured by the Gold ETF (GLD), fell more than a percentage point more than the S&P 500, while Bitcoin, as tracked by the Bitcoin ETF (IBIT), lost nearly 5%. Bitcoin’s performance was even worse than the Nasdaq 100 ETF (QQQ), which some would consider a more digital version of the S&P 500. While equities, gold, and Bitcoin were all down last week, the weakness was more of an anomaly relative to this year’s trend for equities, while it was a continuation of a trend of weakness for gold and Bitcoin, which were both already down YTD heading into last week.
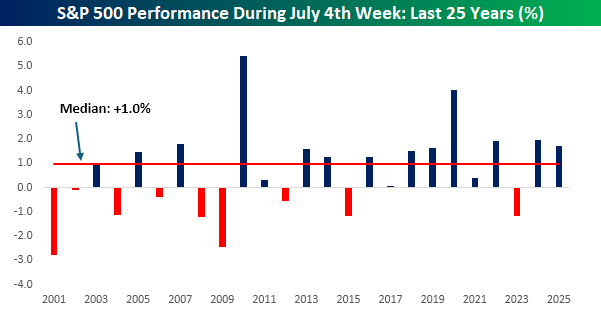
The rally in futures this morning comes right on cue for what is typically a positive time of year for equities. As shown in the chart below, the S&P 500’s median performance during the July 4th week over the last 25 years has been a gain of 1.0%, with positive returns just under two-thirds of the time. In more recent years, performance has been even stronger with a median gain of 1.6% and positive returns nine out of ten times.
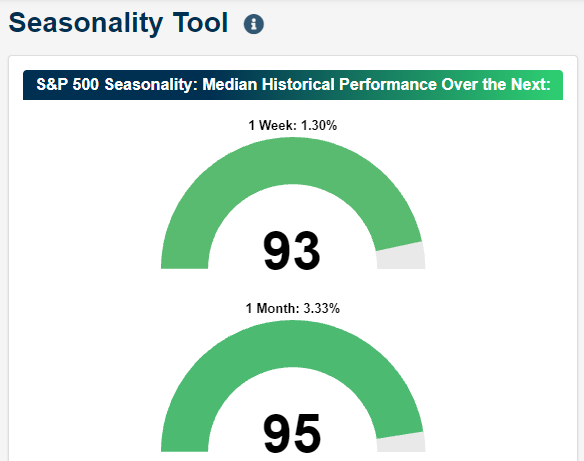
The strong seasonal tailwind shows up in our Seasonality Tool as well. As shown in the snapshot below, the S&P 500’s median one-week and one-month returns from the close today rank in the 93rd and 96th percentile relative to all other periods of the year with gains of 1.3% and 3.45%, respectively.
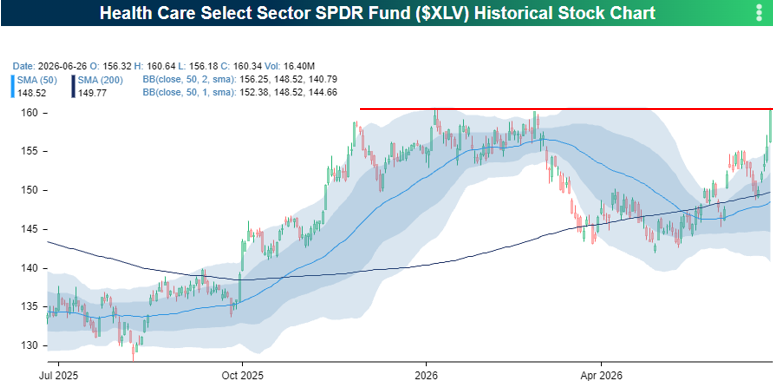
Even with the S&P 500 down over 2% last week, most sectors finished higher. Leading the charge were Real Estate (XLRE), Utilities (XLU), and Health Care (XLV), which were all up over 3%. Health Care’s massive 7%+ surge was its largest single-week gain in over a year, single-handedly rescuing the sector from a YTD loss to a 3%+ gain.
As shown in the chart below, last week’s rally took the sector ETF right up to key resistance around $160. This is a formidable ceiling: XLV failed to break it three times late last year and early this year, and it previously stalled out there back in the summer of 2024. The sector has now had about two years to convalesce, so we’ll see if this base is strong enough to finally push it into a higher trading range.
Start a two-week trial to Bespoke Premium to continue reading today’s full Morning Lineup.
Brunch Reads – 6/28/26
Welcome to Bespoke Brunch Reads — a linkfest of some of our favorite articles over the past week. The links are mostly market-related, but there are some other interesting subjects covered as well. We hope you enjoy the food for thought as a supplement to the research we provide you during the week.
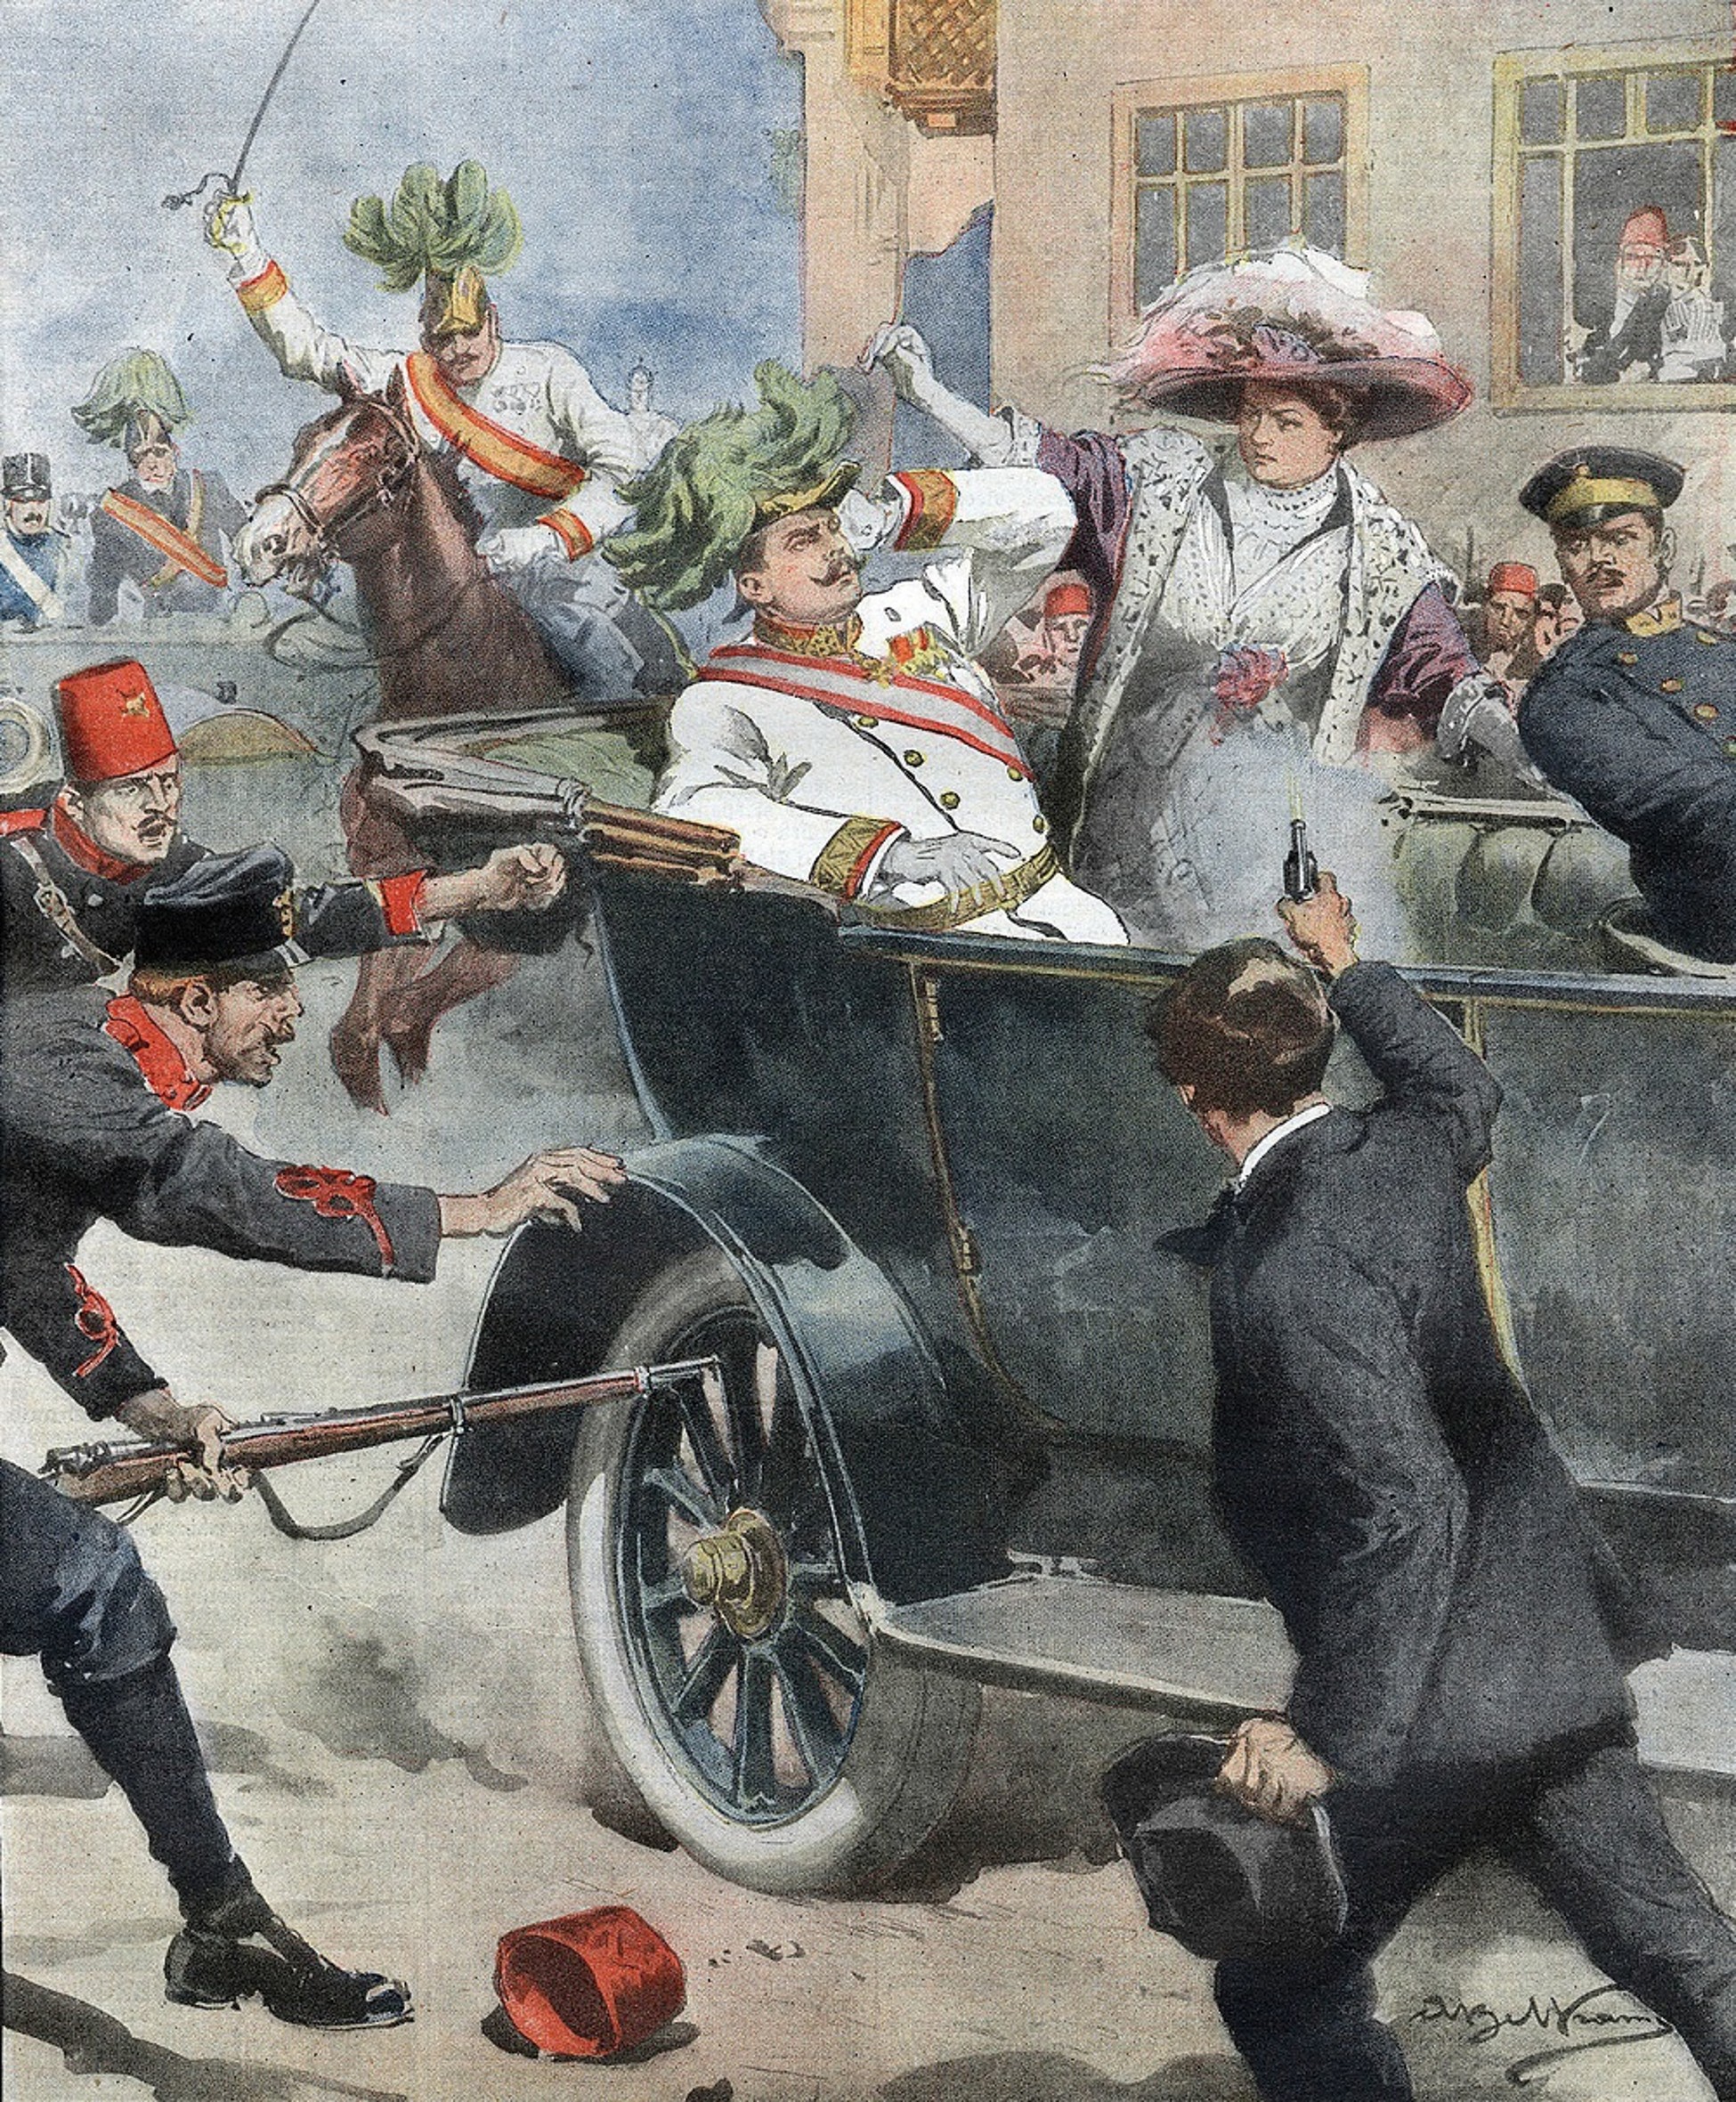
Two Shots in Sarajevo: By June 1914, Europe was divided into rival alliances and dealing with growing nationalism, military competition, and disputes over territory. Tensions were especially high in the Balkans, where Serbia supported efforts to unite South Slavic peoples, including those living under Austro-Hungarian rule. Archduke Franz Ferdinand, heir to the Austro-Hungarian throne, became a target for Serbian nationalist militants when he visited Sarajevo, the capital of Bosnia, on June 28, 1914.
During the visit, several conspirators positioned themselves along the archduke’s motorcade route. One threw a bomb at his car, but it bounced away and exploded beneath another vehicle. Later that morning, Franz Ferdinand decided to visit people injured in the attack. After his driver took a wrong turn and stopped to reverse, 19-year-old Gavrilo Princip happened to be standing nearby. Princip approached the car and fired two shots, killing Franz Ferdinand and his wife, Sophie.
Austria-Hungary blamed Serbia for the assassination and, with Germany’s support, issued a set of demands that Serbia did not fully accept. Austria-Hungary declared war on Serbia on July 28. The alliance system then brought Russia, Germany, France, Britain, and other countries into the conflict, setting World War I and, subsequently, World War II, into motion.
Business
Secretive Wall Street Powerhouse Jane Street Seizes the AI Spotlight (WSJ)
Jane Street has grown into one of Wall Street’s most profitable firms, earning nearly twice as much as Goldman Sachs or Morgan Stanley last quarter with a fraction of their staff. After decades of secrecy, it is becoming more public to recruit AI talent, attract startup investments, and expand its use of the technology in trading. [Link]
Continue reading our weekly Brunch Reads linkfest by logging in if you’re already a member or signing up for a trial to one of our two membership levels shown below! You can cancel at any time.

The Bespoke Report – Equity Market Pros and Cons – Q3 2026
This week’s Bespoke Report is an updated version of our “Pros and Cons” edition for Q3 2026.
With this report, you’re able to get a complete picture of the bull and bear case for US stocks right now. It’s heavy on graphics and light on text, but we let the charts and tables do the talking.
On page three of the report, you’ll see a full list of the pros and cons that we lay out. Slides for each topic are then provided on page four and beyond.
To read this report and access everything else Bespoke’s research platform has to offer, start a trial to any of our three membership levels today!

Daily Sector Snapshot — 6/26/26
A Month For “the Rest”
We’ve made numerous mentions of the weakness in mega-cap stocks so far this month, and given their weightings in the S&P 500, the impact on the index is notable. The S&P 500 peaked on 6/2 and quickly sold off in the early days of June. A mid-month rally brought the market back near its prior highs, but momentum has stalled since 6/15 with a string of weak days with consistent intraday selling.
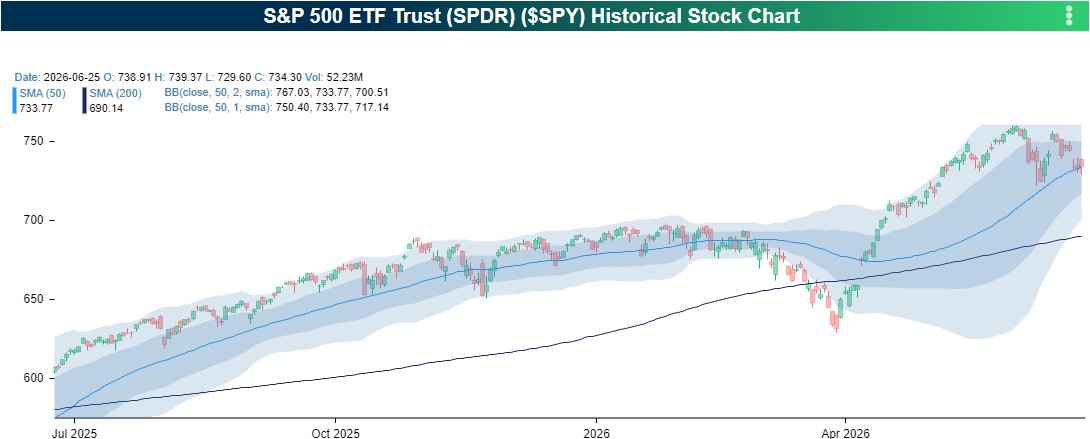
Although the cap-weighted S&P 500 has been weak, performance outside the largest eight stocks has been better, and the average stock has seen modest gains this month. This is reflected in the performance of the S&P 500 Equal Weight index as proxied by the RSP ETF. Unlike the cap-weighted index, RSP made a higher high in mid-June, but it has also seen some, although not as consistent, weakness in the last few days.
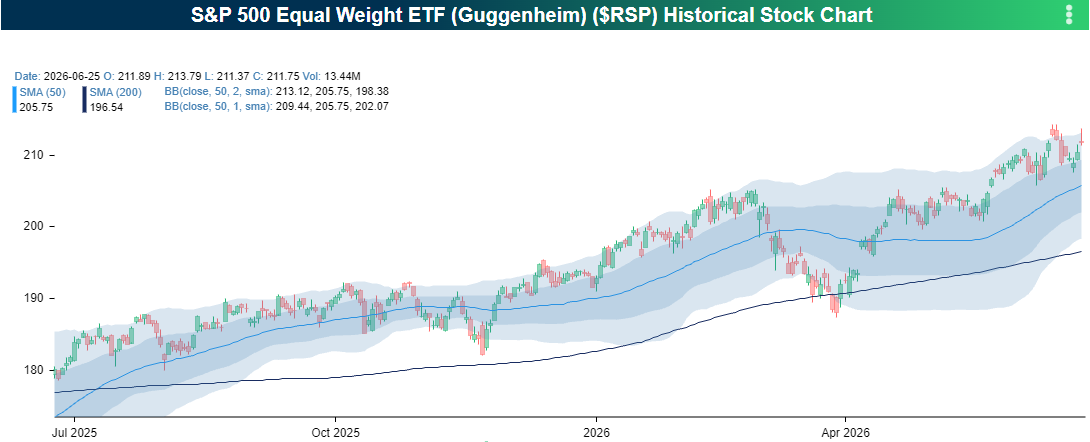
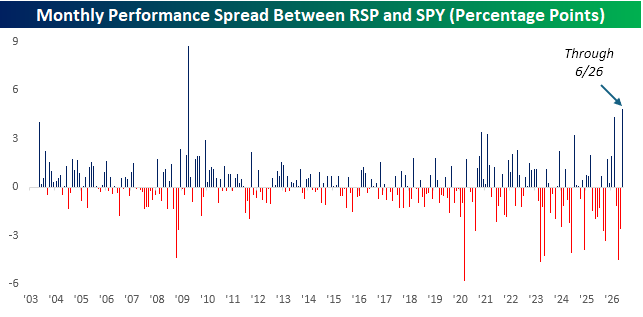
With their divergent returns, the cap-weighted S&P 500 (SPY) is down 2.4% this month, while the equal-weighted (RSP) is up 2.4% for a performance gap of 4.8 percentage points. There are still a few days left in the month, but this type of divergence is nearly unheard of.
What’s also interesting about the divergent returns is that this June is on pace to be the second time this year that the monthly performance spread between the two indices exceeded four percentage points. In the nearly 17 years from the launch of RSP in 2003 through 2019, the monthly performance gap between RSP and SPY was typically narrow, exceeding three percentage points just three times. In the six and a half years since then, though, there have been twelve separate months when the performance spread exceeded three percentage points. Quadruple the occurrences in nearly a third of the time!
Investors can’t seem to make up their minds. Do they want the mega caps or everyone else?
Want more from Bespoke? You can start by joining our Think BIG mailing list, where you’ll receive an interesting market stat in your inbox a few times per week. All we need is your email address. Join now by clicking here or on the image below.

Bespoke’s Morning Lineup – 6/26/26 – Limping into the Weekend
See what’s driving market performance around the world in today’s Morning Lineup. Bespoke’s Morning Lineup is the best way to start your trading day. Read it now by starting a two-week trial to Bespoke Premium. CLICK HERE to learn more and start your trial.
“In bear markets, stocks usually open strong and close weak. In bull markets, they tend to open weak and close strong.” – William J. O’Neill
Below is a snippet of commentary from today’s Morning Lineup. Start a two-week trial to Bespoke Premium to view the full report.
After a strong start and intraday sell-off yesterday, futures have equities in the penalty box to start the last session of the week, so we’ll see if bulls can make a stand into the weekend. S&P 500 futures are down 0.40% while the Nasdaq looks to open down just over 1%. Treasury yields are modestly lower, while crude oil trades down more than 2.5% and barely hangs onto the $70 level. Gold prices are modestly higher, while Bitcoin looks to bounce but remains below $60K.
Asian stocks ended the week with a thud. The Nikkei was up over 1% heading into Friday’s session, but a 4.2% decline pushed that index into a 2.7% decline for the week. South Korea fell 5.8% in the session and 7.1% for the week, while onshore China stocks fell a relatively modest 2.3% and just 1.6% for the week. The main culprit for the weakness was in the technology sector, specifically memory stocks. Japanese inflation data didn’t help either as Tokyo CPI accelerated to 1.7% y/y at the headline level versus 1.4% in May,
European stocks don’t have nearly the exposure to technology that Asia and the US have, but that isn’t stopping indices in the region from falling. The STOXX 600 is down nearly 1%, putting it into negative territory for the week. Germany and the UK are leading today’s losses with declines of more than 1%, while Spain has been the region’s outperformer, falling just 0.4%. Looking on the bright side, a survey from the ECB showed consumer near-term inflation expectations falling from 3.9% down to 3.5%.
In the US today, the only economic reports on the calendar are Wholesale Inventories at 8:30, followed by Michigan sentiment at 10 AM. The Michigan report is notoriously negative, so don’t expect much optimism, although the survey of inflation expectations will be watched for signs of improvement.
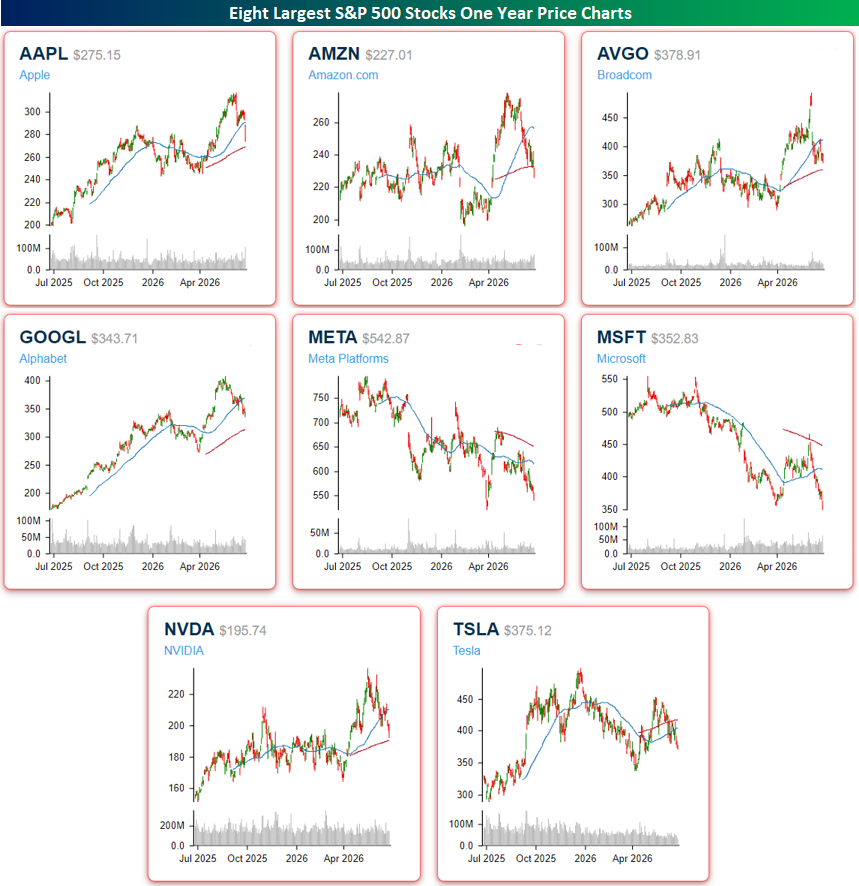
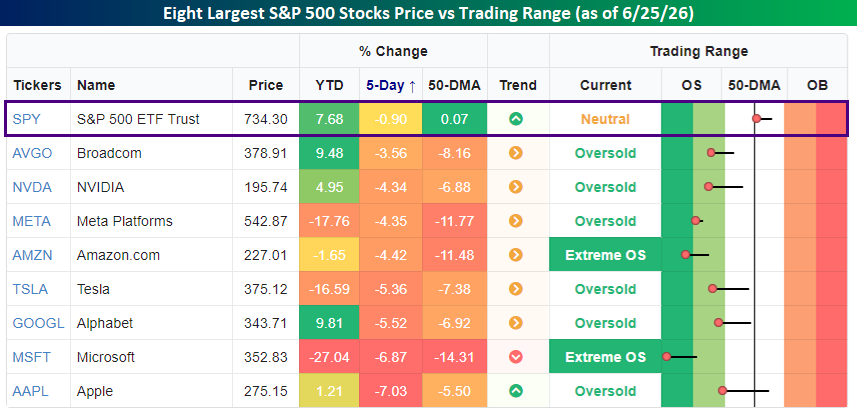
It’s been a rough June for megacap tech stocks. Through yesterday’s close, all eight of the largest S&P 500 stocks are below their 50-day moving averages, and in the case of Amazon.com (AMZN), Meta (META), Microsoft (MSFT), and Tesla (TSLA), they’re also below their 200-day moving averages.
All eight stocks, which account for about 38% of the entire S&P 500, are down anywhere between 3.5% to 7.0% over the last week, and they’re all at oversold levels trading at least 5% below their 50-day moving averages. Despite these oversold levels in nearly 40% of the S&P 500, the index itself is down less than 1% over the last week and remains above its 50-day moving average.
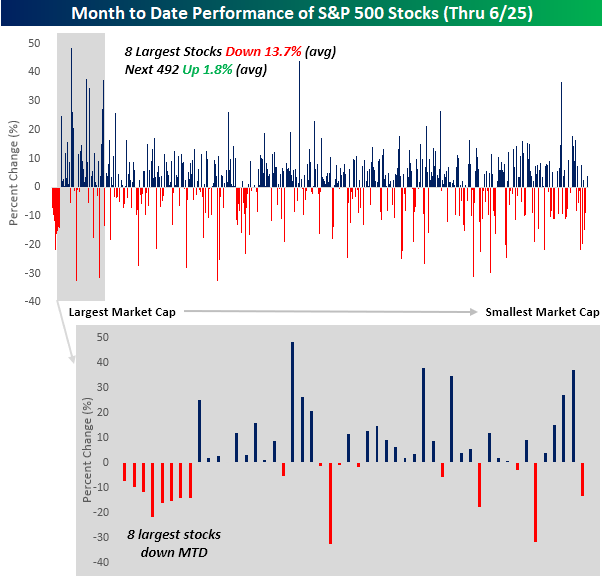
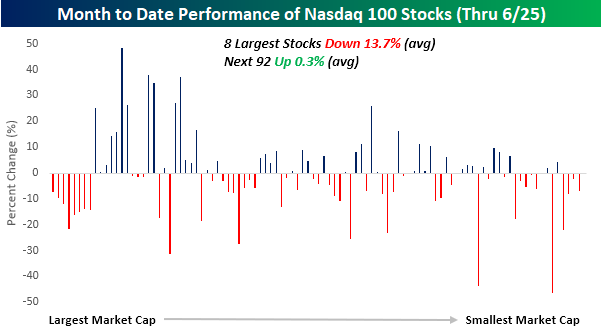
A look at the monthly performance of S&P 500 stocks shows the concentration of weakness among the largest S&P 500 stocks. The chart is sorted by market cap, so the largest stocks are on the left side of the x-axis, and the smallest ones are on the right. Note the deep concentration of red on the left. In fact, besides the eight largest stocks, there’s no other point in the chart where eight stocks in a row have negative returns this month!
Overall, the eight largest stocks in the S&P 500 are down an average of 13.7% this month, while the next 492 are up an average of 1.8%. In June, bigger hasn’t been better.
For the Nasdaq 100, it has been a similar trend. The eight largest stocks in the Nasdaq 100, which are also the eight largest stocks in the S&P 500, are down an average of 13.7%, and all are lower this month. Among the 92 other stocks in the index, though, the average performance this month has been a 0.3% gain.
Start a two-week trial to Bespoke Premium to continue reading today’s full Morning Lineup.
The Closer – Breadth Disconnects, Price Hikes, PCE – 6/25/26
Log-in here if you’re a member with access to the Closer.
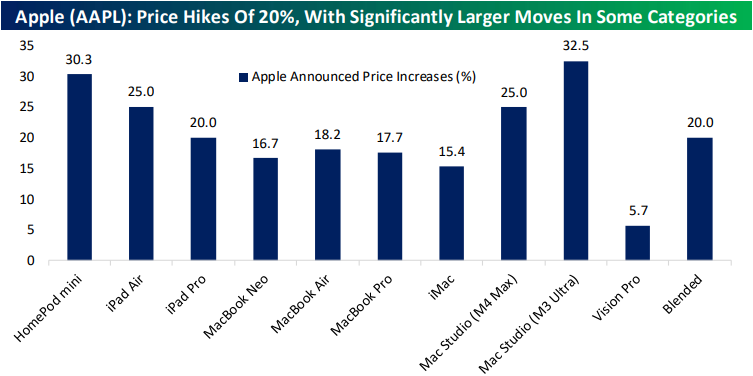
- Consumer electronic devices are beginning to see price hikes as a result of higher memory prices.
- The S&P 500 has had a record share of days over the past 50-, 120-, and 200-trading days where price went in one direction and daily breadth went in the other.
- All rates of change for core PCE ex. rent are above 2%, meaning that even with zero rent core inflation is still comfortably above target.
See today’s full post-market Closer and everything else Bespoke publishes by starting a 14-day trial to Bespoke Institutional today!
Bespoke’s Weekly Sector Snapshot — 6/25/26
Q2 2026 Earnings Conference Call Recaps: Winnebago (WGO)
Bespoke’s Conference Call Recaps use AI to summarize lengthy earnings calls. The commentary below is AI-generated and then edited by Bespoke for quality control. As always, none of these summaries should be construed as recommendations to buy or sell any securities, and investors should do their own research and/or consult with a financial professional before making any investment decisions.
Our latest recap available to Bespoke subscribers covers Winnebago’s (WGO) Q3 2026 earnings call.

Winnebago (WGO) is a diversified outdoor-recreation manufacturer of motorhomes, travel trailers, fifth wheels, and boats through brands like Winnebago, Grand Design, Newmar, Barletta, and Chris-Craft. Its mix of entry-level, premium, and luxury products gives investors a useful read on discretionary spending, financing-sensitive big-ticket purchases, dealer inventories, and the gap between affluent and middle-income consumers. Demand weakened from late March as inflation, high interest rates, geopolitical uncertainty, and low consumer confidence delayed purchases. Revenue fell 9.9% to $698.7 million, though Motorhome sales rose and operating profit improved to $9.6 million from a loss, helped by Grand Design Motorized, Newmar, and newer Winnebago products. Dealers remain financially stable but are ordering cautiously, clearing 2026 inventory, and targeting faster inventory turns. Winnebago expects fourth-quarter sales to fall sequentially and by double digits year-over-year. Management is cutting capacity and fixed costs while introducing cheaper products, including the $15,000–$16,000 Transcend Lite and roughly $50,000 Barletta Sanza. Luxury Chris-Craft demand remains stable, while middle-market products face the most pressure, and used RVs are taking share from new units. WGO reported weaker-than-expected EPS and revenue, and cut guidance, as investors shrugged the poor results off and the stock rallied more than 12% on 6/25…
Continue reading our Conference Call Recap for WGO by becoming a Bespoke Institutional subscriber. You can sign up for Bespoke Institutional now and receive a 14-day trial to read our newest Conference Call Recap. To sign up, choose either the monthly or annual checkout link below:
Mega-Caps Fall, Russell Rebalance
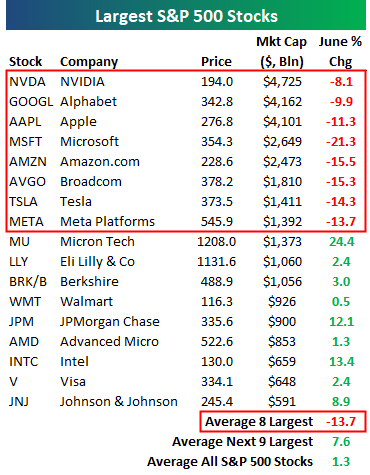
There are still a few trading days left in June, but so far it has been a rough month for the world’s largest stocks. In the month where SpaceX (SPCX) began trading as the biggest IPO in history with a market cap near $2 trillion, the eight largest stocks in the S&P 500 have all fallen at least 8%, with six of eight down 10%+. Did SpaceX suck the life out of the rest of its mega-cap brethren?
Notably, the eight largest stocks are all down this month for an average decline of 13.7%, but the next nine largest stocks are all up this month for an average gain of 7.6%.
Tomorrow we’re also going to see one of the biggest rebalances in history for key Russell indices. With the halfway point of 2026 coming up, Russell is rebalancing its indices by moving stocks in and out of its large-cap Russell 1,000 and small-cap Russell 2,000.
The small-cap Russell 2,000 is sitting on a nice 20% gain this year mostly on the back of its largest index members.
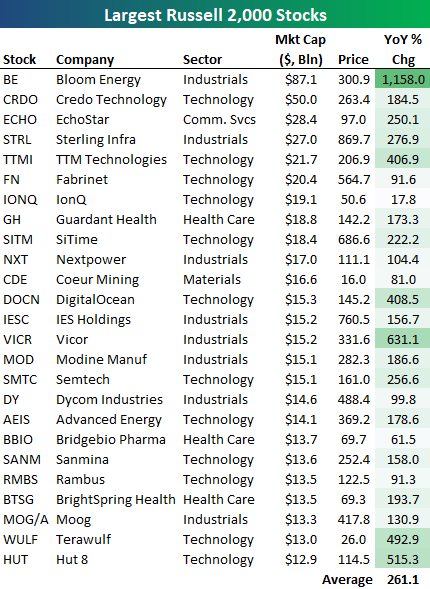
The peak market cap for inclusion in the small-cap Russell 2,000 has historically been $5.7 billion, but right now there are 165 stocks in the index with market caps above that mark, including six stocks with market caps above $20 billion, and two above $50 billion. Bloom Energy (BE) is the Russell 2,000’s largest stock by far at $87.1 billion. It’s up more than 1,100% over the last year.
Russell doesn’t provide a full list of the stocks moving up into the large-cap Russell 1,000 from the small-cap Russell 2,000, but they’ve said that 43 stocks will be making the jump tomorrow. Simply looking at the largest stocks in the Russell 2,000 gives you a pretty good idea of which ones will be graduating into the Russell 1,000.
Below is a list of the 25 largest Russell 2,000 stocks right now along with their year-over-year percentage change. As shown, all 25 of these stocks are up over the last year for an average gain of 261%!
You can bet that the large majority of these names will no longer be in the Russell 2,000 when trading begins next week, meaning the index itself is going to look and act a lot different in the second half of the year.
Want more from Bespoke? You can start by joining our Think BIG mailing list, where you’ll receive an interesting market stat in your inbox a few times per week. All we need is your email address. Join now by clicking here or on the image below.