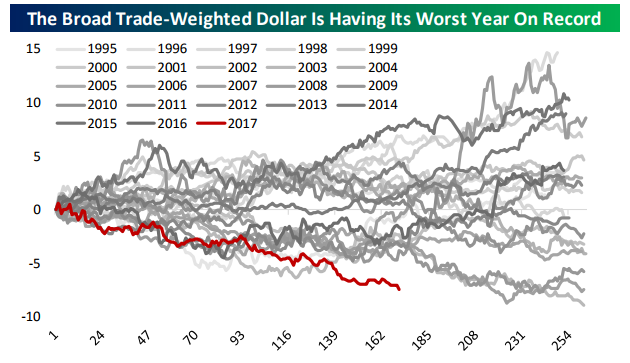
Worst Year for the Dollar Since 1986
Entering 2017, the USD had been up four years running on a broad trade-weighted basis with 8.6% gains in 2014, 10.7% appreciation in 2015 and a more modest 3.0% move in 2016. That last year was a less dramatic move but from May 2nd lows to the 15+ year peak on January 7th, the buck was up almost 9.3% or 14.5% at an annual pace.
Unfortunately for greenback bulls, things have gone wildly off-script since. The dollar has reversed its entire May 2016-January 2017 rally in a move that’s frankly shocked the FX world. As shown below, for the broad trade weight dollar this was the worst year on record through last Friday (latest data available) and the route has gotten worse this week with the Bloomberg USD Index (a decent proxy for the USD broad trade-weighted index) down a whopping 1.5% this week, its worst since the 5 days ending May 19th. Given that US economic data has actually held up quite well and there have been no radical policy shifts from the FOMC, that’s a pretty staggering move.
On a narrow major currency basis, the USD is just as weak. As shown below, this was the worst YTD through September 1st since 1986 (the year following the Plaza Accord agreement to devalue the USD) and the second-worst ever after this week’s decline, besting the 10% devaluation of the dollar engineered in 1973. Again, the contrast between the surging dollar post-election and the strong USD environment that prevailed for years before that event has been incredible: the dollar just won’t stop falling after it wouldn’t stop rising for years.
Take advantage of our Labor Day Special to see further analysis of the dollar’s decline, valuation, and investment implications.

B.I.G. Tips – US Dollar Collapse Continues
ETF Trends: Hedge – 9/8/17
City-By-City Home Price Gains and Losses Since the Housing Bubble
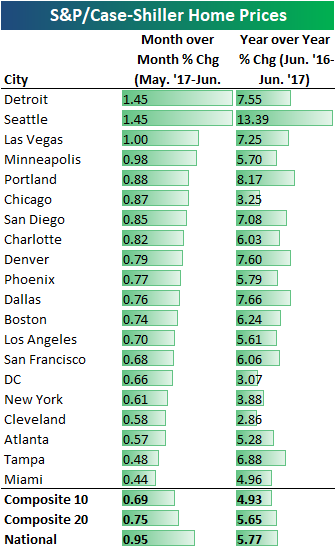
Below is an updated snapshot of home price trends for major cities/regions around the US. Using S&P/Case-Shiller data, the first table below shows the most recent month-over-month and year-over-year percentage change in median home prices.
As you can see, Detroit and Seattle saw the biggest month-over-month jumps most recently, followed by Las Vegas, Minneapolis, and Portland. Atlanta, Tampa and Miami saw the smallest gains, but they were gains nonetheless.
On a year-over-year basis, Seattle (thank you Amazon!) home prices are up the most at +13.39%. Behind Seattle is its neighbor to the south, Portland, with a gain of 8.17%. Dallas, Denver, Detroit, and San Diego saw 7%+ gains as well.
Nationwide, median home prices are up 5.77% year-over-year.
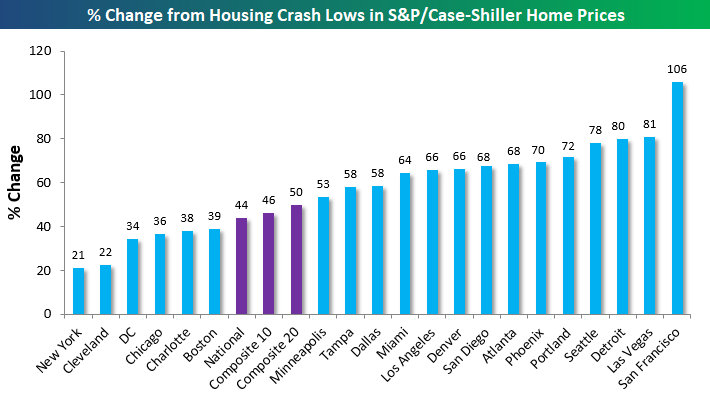
Below is a look at how much home prices are up compared to their low points following the housing crash of the mid to late 2000s. The composite indices are all up 45-50% from their lows, while San Francisco is up by far the most of any city with a gain of 106%. Las Vegas, Detroit, and Seattle rank 2nd through 4th, and Portland rounds out the top five with a gain of 72% off its lows.
On the weak side, New York and Cleveland have seen median home prices rise the least off their housing crash low points at just over 20%.
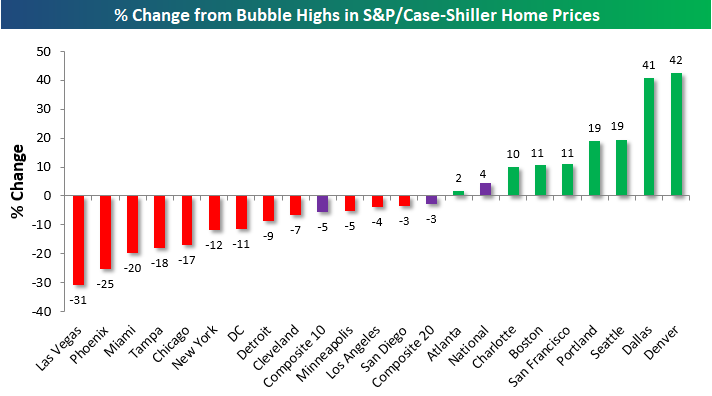
Along with looking at bounces off the lows, we can also look at how far away each city is from its housing bubble high. Here we take the high point in prices that were seen during the bubble of the mid-2000s and compare them to current home price levels. Any city with a positive reading has prices that have already moved above their prior bubble highs, while any city with a negative reading still has to make further gains to get back to even. Denver and Dallas are already well above their prior housing bubble highs at 40%+. Seattle, Portland, San Francisco, Boston, Charlotte, and Atlanta are the remaining cities that have eclipsed their prior highs. On the down side, even though Las Vegas is up 80% off its housing crash lows, it’s still 31% below its housing bubble highs. That shows you just how big the Las Vegas bubble (and burst) was.
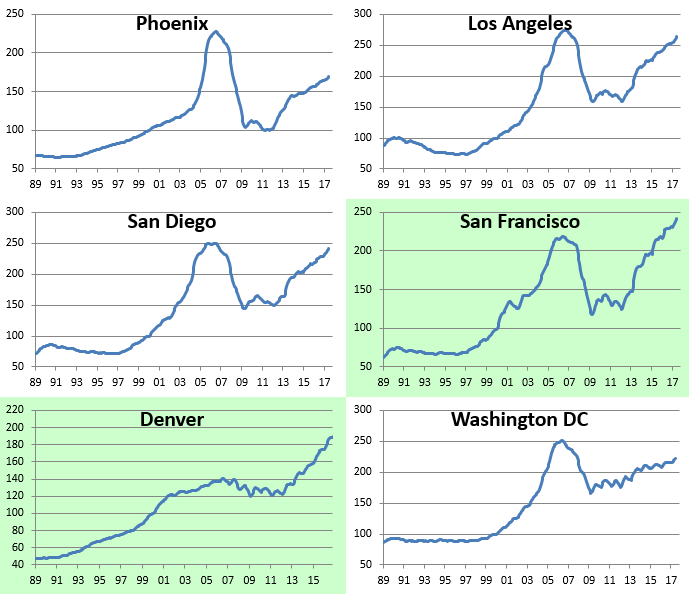
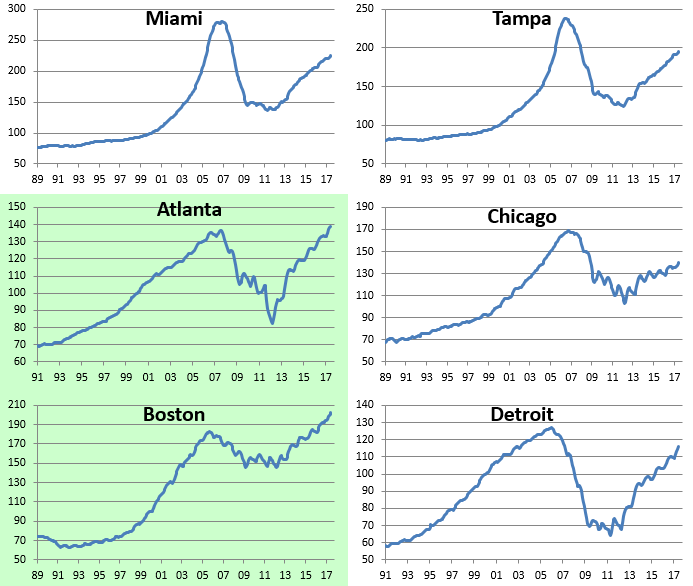
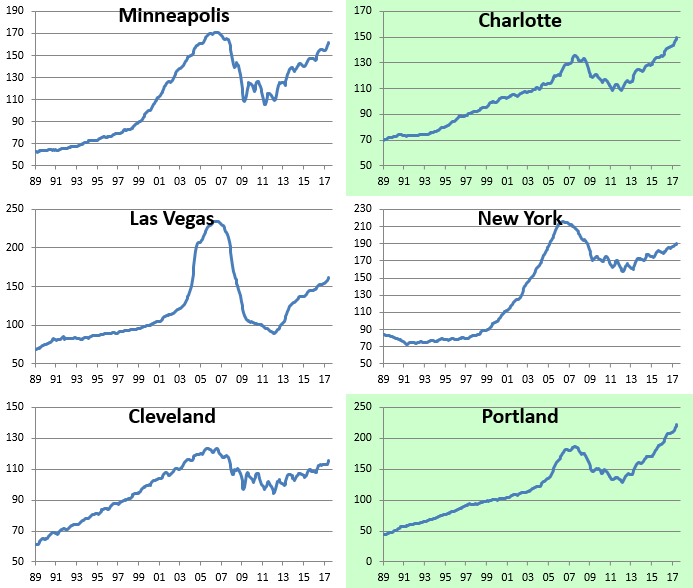
Below we show median home price charts from S&P/Case Shiller going back to 1989 for all of the major cities that are tracked. Cities shaded in green are at new highs. Note that the National reading is also at a new high, having recently surpassed its prior housing bubble levels.
Take advantage of our extended Labor Day Special, where you receive a month of full access to any one of our research services for just $1 and then 20% off for the life of the subscription!

The Closer — Production & Productivity — 9/7/17
Log-in here if you’re a member with access to the Closer.
Looking for deeper insight on global markets and economics? In tonight’s Closer sent to Bespoke Institutional clients, we review weekly EIA data and the BLS Nonfarm Productivity and Costs revisions.

The Closer is one of our most popular reports, and you can sign up for a free trial below to see it!
See today’s post-market Closer and everything else Bespoke publishes by starting a no-obligation 14-day free trial to our research platform!
Bespoke’s Sector Snapshot — 9/7/17
We’ve just released our weekly Sector Snapshot report (see a sample here) for Bespoke Premium and Bespoke Institutional members. Please log-in here to view the report if you’re already a member. If you’re not yet a subscriber and would like to see the report, please start a 30-day trial to Bespoke Premium now.
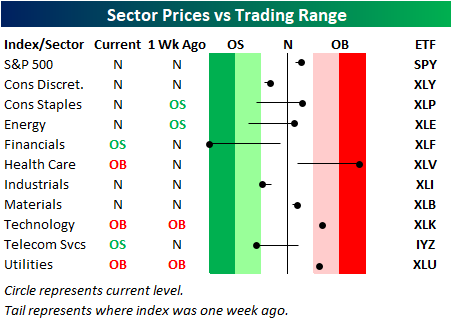
Below is one of the many charts included in this week’s Sector Snapshot, which shows our trading range screen for the S&P 500 and ten major sectors. The dot represents where each sector is currently trading, while the tail end represents where it was trading one week ago. The black vertical “N” line represents each sector’s 50-day moving average. Moves into the red zone are considered “overbought,” while moves into the green zone are considered “oversold.”
Notably, the Financial sector is about as oversold as it gets right now. At the same time, the Health Care sector is about as overbought as it gets. You don’t often see this occur at the same time for two of the largest sectors in the S&P 500.
To see our full Sector Snapshot with additional commentary plus six pages of charts that include analysis of valuations, breadth, technicals, and relative strength, start a 30-day free trial to our Bespoke Premium package now. Here’s a breakdown of the products you’ll receive.
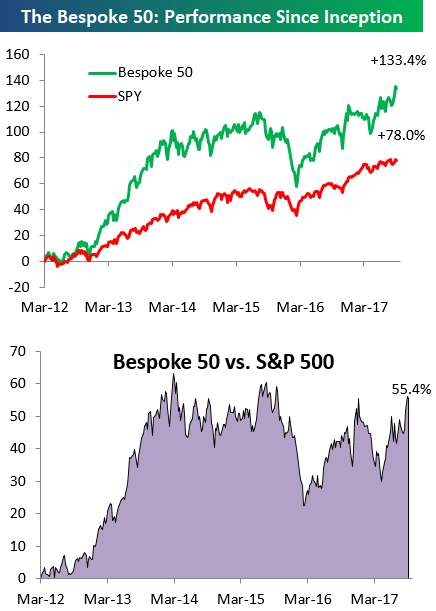
the Bespoke 50 — 9/7/17
Every Thursday, Bespoke publishes its “Bespoke 50” list of top growth stocks in the Russell 3,000. Our “Bespoke 50” portfolio is made up of the 50 stocks that fit a proprietary growth screen that we created a number of years ago. Since inception in early 2012, the “Bespoke 50” has beaten the S&P 500 by 55.4 percentage points. Through today, the “Bespoke 50” is up 133.4% since inception versus the S&P 500’s gain of 78.0%. Always remember, though, that past performance is no guarantee of future returns.
To view our “Bespoke 50” list of top growth stocks, sign up for Bespoke Premium ($99/month) at this checkout page and get your first month free. This is a great deal!