Retailers Coming Up Short
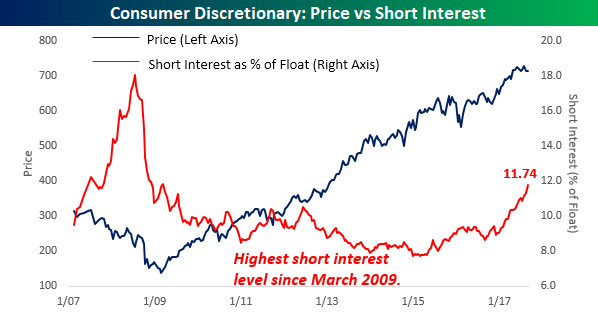
Short interest figures for the end of August were released on Tuesday, and as far as the overall trends were concerned, let’s just say that investors were quite nervous heading into what has historically been the stock market’s worst performing month. To see our complete analysis of the recent results, sign up for Bespoke Premium or Bespoke Institutional now. One sector where investors are particularly negative these days is in the Consumer Discretionary sector. Through the end of August, the average stock in the S&P 500 had 11.7% of its float sold short. That’s the highest average short interest reading since March 2009! Think about that for a minute — investors haven’t been this negative towards the Consumer Discretionary sector since the very beginning of the bull market!
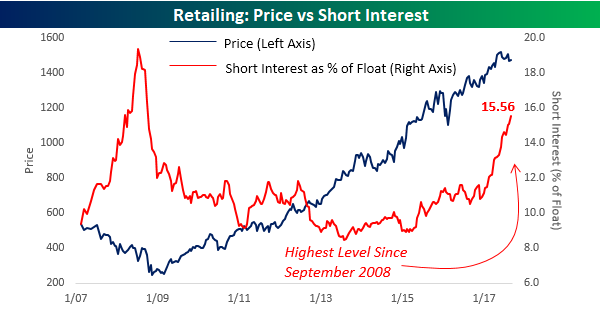
The main culprit behind the high levels of short interest has been in the Retailing group, where average short interest levels currently stand at 15.6%. That’s the highest level for this Industry Group since September 2008 when Lehman went bankrupt!
Gain access to 1 month of any of Bespoke’s membership levels for $1!
The reason for the negative sentiment towards retail stocks is obviously the “Death by Amazon” trade as well as the shift in consumer preferences towards experiences over products. Nowhere is this more evident than in the short interest levels of Multi-Line retailers. Here, short interest levels have gone ‘hockey stick,’ surging from an already high level of 12% at the end of last year to an absurdly high level of 25.2% as of the end of September. That kind of surge in such a short period of time is the type of move we saw in banks and brokerage stocks during the height of the financial crisis.

The Closer — The Death of Paper, Producer Prices Accelerate — 9/13/17
Log-in here if you’re a member with access to the Closer.
Looking for deeper insight on global markets and economics? In tonight’s Closer sent to Bespoke Institutional clients, we review the decline in the US commercial paper market, today’s producer price index report from the BLS, the recent reversal off 52-week highs for gold, and technicals for two exchange rates and the ten year yield.

The Closer is one of our most popular reports, and you can sign up for a free trial below to see it!
See today’s post-market Closer and everything else Bespoke publishes by starting a no-obligation 14-day free trial to our research platform!
Short Interest Report – 9/13/17
ETF Trends: Fixed Income, Currencies, and Commodities – 9/13/17
Fixed Income Weekly – 9/13/17
Searching for ways to better understand the fixed income space or looking for actionable ideals in this asset class? Bespoke’s Fixed Income Weekly provides an update on rates and credit every Wednesday. We start off with a fresh piece of analysis driven by what’s in the headlines or driving the market in a given week. We then provide charts of how US Treasury futures and rates are trading, before moving on to a summary of recent fixed income ETF performance, short-term interest rates including money market funds, and a trade idea. We summarize changes and recent developments for a variety of yield curves (UST, bund, Eurodollar, US breakeven inflation and Bespoke’s Global Yield Curve) before finishing with a review of recent UST yield curve changes, spread changes for major credit products and international bonds, and 1 year return profiles for a cross section of the fixed income world.
In this week’s note, we note how aggressively tight global corporate and EM sovereign credit risk premiums have gotten.
Our Fixed Income Weekly helps investors stay on top of fixed income markets and gain new perspective on the developments in interest rates. You can sign up for a Bespoke research trial below to see this week’s report and everything else Bespoke publishes free for the next two weeks!
Click here to start your no-obligation free Bespoke research trial now!
Chart of the Day: Weak Breadth at New Highs
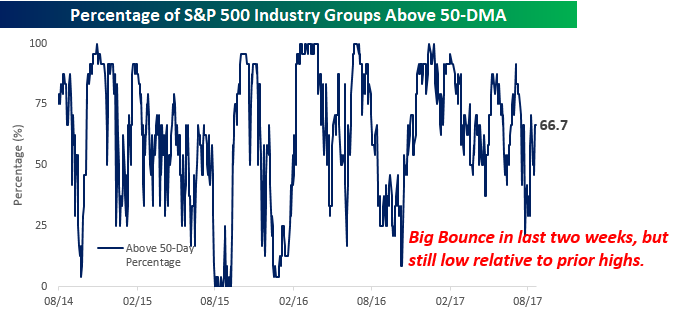
Yesterday was an encouraging day for bulls and anyone else long US equities as the S&P 500, Nasdaq, and Dow all hit new all-time highs for the first time since July. It’s great to see the market trading at new highs, but as we have been highlighting for some time now, some measures of breadth have been relatively weak for the last few weeks now. A case in point is the percentage of S&P 500 Industry Groups trading above their 50-day moving averages (DMA). As shown in the chart below, while we have seen a big bounce from late August when less than a third were above their 50-DMAs, at yesterday’s close just two-thirds of Industry Groups were above their 50-DMAs. Relative to other times this year when the S&P 500 hit a new high, this reading is on the low side.
We focus on breadth in our analysis frequently, and while we often tell clients that weak breadth is negative at the margin, in today’s Chart of the Day, we use data to either prove or disprove it. To see the analysis, login if you’re already a member or join one of our three membership levels at a special $1 introductory rate.
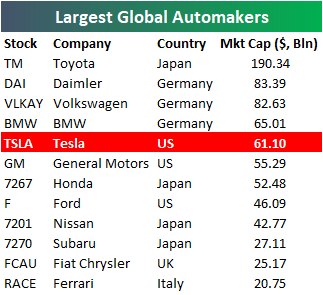
Tesla (TSLA) Now the Biggest US Auto Company (If You Want to Call It an Auto Company)
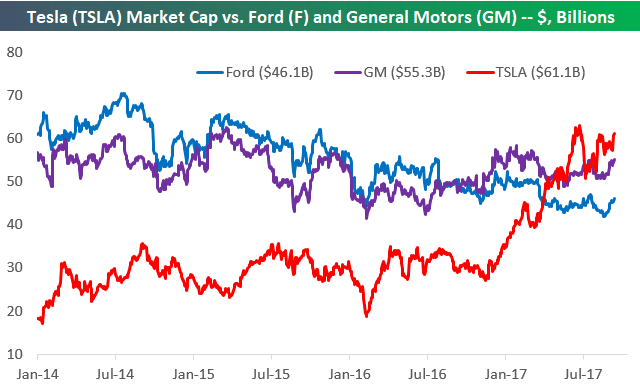
Tesla (TSLA) has zoomed past both Ford (F) and General Motors (GM) to become the largest automaker in the US. You can see the meteoric rise for Tesla (TSLA) in the market cap comparison chart below.
Gain access to 1 month of any of Bespoke’s membership levels for $1!
Tesla (TSLA) is not only larger than the two main US automakers, but it’s also larger than many of the international automakers that you’re familiar with as well. Toyota (TM) is by far the largest company in the table below, but Tesla (TSLA) is in spitting distance of the three German automakers — Daimler (DAI), Volkswagen (VLKAY), and BMW.
Up until recently, Tesla (TSLA) was always viewed as a car company first and foremost. Within the last year or so, however, the narrative has changed. The standard view now seems to be that Tesla is really a Tech company that happens to manufacture cars (among other things). It’s much easier to justify Tesla’s market cap and valuation when you view it as a Tech company versus comparing it to blue-chip US automakers like Ford or GM.
Bespoke’s Global Macro Dashboard — 9/13/17
Bespoke’s Global Macro Dashboard is a high-level summary of 22 major economies from around the world. For each country, we provide charts of local equity market prices, relative performance versus global equities, price to earnings ratios, dividend yields, economic growth, unemployment, retail sales and industrial production growth, inflation, money supply, spot FX performance versus the dollar, policy rate, and ten year local government bond yield interest rates. The report is intended as a tool for both reference and idea generation. It’s clients’ first stop for basic background info on how a given economy is performing, and what issues are driving the narrative for that economy. The dashboard helps you get up to speed on and keep track of the basics for the most important economies around the world, informing starting points for further research and risk management. It’s published weekly every Wednesday at the Bespoke Institutional membership level.
Click here for a special $1 introductory Bespoke Institutional membership rate.

The Closer — Tax Reform On Ice, Eurozone NPL Progress, EM Stimulus Needed — 9/12/17
Log-in here if you’re a member with access to the Closer.
Looking for deeper insight on global markets and economics? In tonight’s Closer sent to Bespoke Institutional clients, we review what sort of likelihood the S&P 500 is pricing for tax reform this year. We also take a deep dive into nonperforming loan stats for the Eurozone and find some good news. Finally, we make the case that EMs still have lots of room – and need – to stimulate via rate cuts.
The Closer is one of our most popular reports, and you can sign up for a free trial below to see it!
See today’s post-market Closer and everything else Bespoke publishes by starting a no-obligation 14-day free trial to our research platform!