The Closer — Mark To Hawkish, Dow 1 Million, No Homes Left To Buy — 9/20/17
Log-in here if you’re a member with access to the Closer.
Looking for deeper insight on global markets and economics? In tonight’s Closer sent to Bespoke Institutional clients, we review the FOMC policy decision today, as well as investigating the feasibility of Dow 1 Million and reviewing existing home sales data.

The Closer is one of our most popular reports, and you can sign up for a free trial below to see it!
See today’s post-market Closer and everything else Bespoke publishes by starting a no-obligation 14-day free trial to our research platform!
Chart of the Day: Sector Performance Following Fed Days
B.I.G. Tips – Extreme Overbought 10-Day A/D Readings By Sector
ETF Trends: Fixed Income, Currencies, and Commodities – 9/20/17
Looking For Action? S&P 1500 Most Volatile Stocks
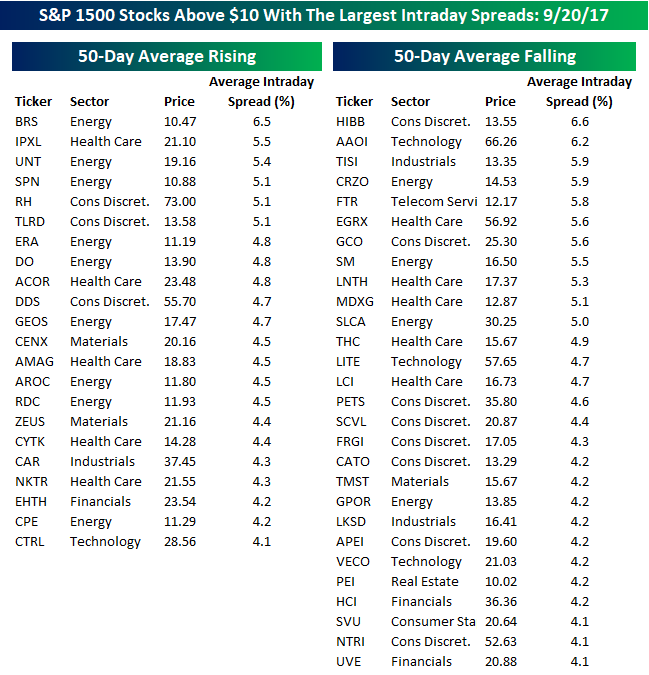
For traders with a short-term time horizon who are looking for big moves over a short period, we have updated our list of the S&P 1500 stocks trading above $10 that have the largest intraday high-low ranges (based on the average percent spread between the intraday high and low over the last 50 days). The stocks are grouped based on whether they have a rising or falling 50-day moving average (DMA).
With overall market volatility being so low that some strategists are asking whether it will ever come back to the markets (reason enough that you can bet it will), individual equity volatility has also been extremely muted. Of the 50 most volatile stocks in the S&P 1500, just 17 have had an average daily move of more than 5% over the last 50 trading days. The most volatile stock in the index has been Hibbett Sports (HIBB), which has averaged a daily move of 6.6%. For a $13 stock, 6% doesn’t amount to a whole lot in dollar terms, but it is still volatile nonetheless. In dollar terms, the stock that has had the largest average daily high-low spread has been Applied Optoelectronics (AAOI). With a $66 share price, AAOI averages a daily move of over $4. AAOI has also been volatile on a longer-term basis, as in the span of three months it has rallied from $60 to $100 and back down to $60!
In terms of sector representation on this month’s list, while names from ten out of eleven sectors made the list (Utilities is the only sector missing), three sectors dominate. With thirteen Energy sector stocks, eleven Consumer Discretionary names, and ten stocks from the Health Care sector, those three sectors account for 70% of our list.
Gain access to 1 month of any of Bespoke’s membership levels for $1!
Fixed Income Weekly – 9/20/17
Searching for ways to better understand the fixed income space or looking for actionable ideals in this asset class? Bespoke’s Fixed Income Weekly provides an update on rates and credit every Wednesday. We start off with a fresh piece of analysis driven by what’s in the headlines or driving the market in a given week. We then provide charts of how US Treasury futures and rates are trading, before moving on to a summary of recent fixed income ETF performance, short-term interest rates including money market funds, and a trade idea. We summarize changes and recent developments for a variety of yield curves (UST, bund, Eurodollar, US breakeven inflation and Bespoke’s Global Yield Curve) before finishing with a review of recent UST yield curve changes, spread changes for major credit products and international bonds, and 1 year return profiles for a cross section of the fixed income world.
In this week’s note, we review the impact of the Toys ‘R’ Us bankruptcy on the rest of the retail credit space.
Our Fixed Income Weekly helps investors stay on top of fixed income markets and gain new perspective on the developments in interest rates. You can sign up for a Bespoke research trial below to see this week’s report and everything else Bespoke publishes free for the next two weeks!
Click here to start your no-obligation free Bespoke research trial now!
Best and Worst Russell 2000 Stocks in September
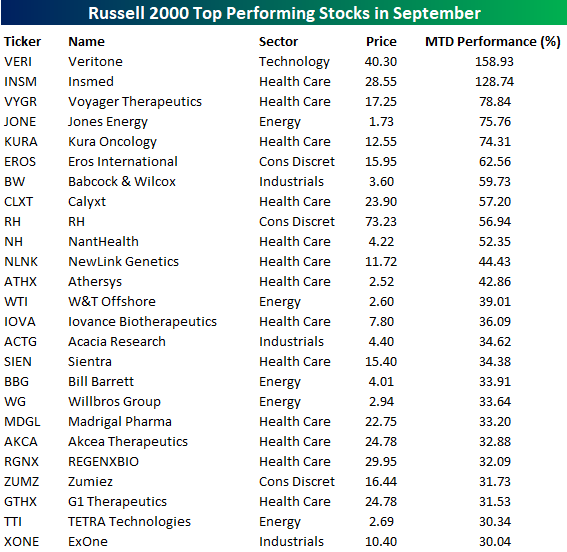
Even though September was supposed to be a weak month, so far we have seen solid gains for equities. One part of the market doing really well is small caps, where the average stock in the Russell 2000 is up over 3.5%. Propping that average up, 256 stocks in the index are up over 10% MTD, and of those 72 are up over 20%.
In the first table below, we list the 25 top performing stocks in the Russell 2000 so far in September. All 25 of these stocks are up over 30% so far this month, but amazingly, a handful are up by multiples of that. Leading the way higher, Veritone (VERI) has surged by over 150% (and that’s after today’s 13% decline) as investors plow into Artificial Intelligence (AI) plays. VERI went public in May and offers a platform which it says can be used to run various AI tasks. Behind VERI, Insmed (INSM) has also seen its share price more than double this month as the company announced positive trial results related to one of its lung disease treatments. Looking at the list of biggest winners, you would likely be hard pressed to find more than a couple of names that you have never even heard of, but if they continue to rally like they have so far this month, it’s only a matter of time before you start hearing about them more.
Gain access to 1 month of any of Bespoke’s membership levels for $1!
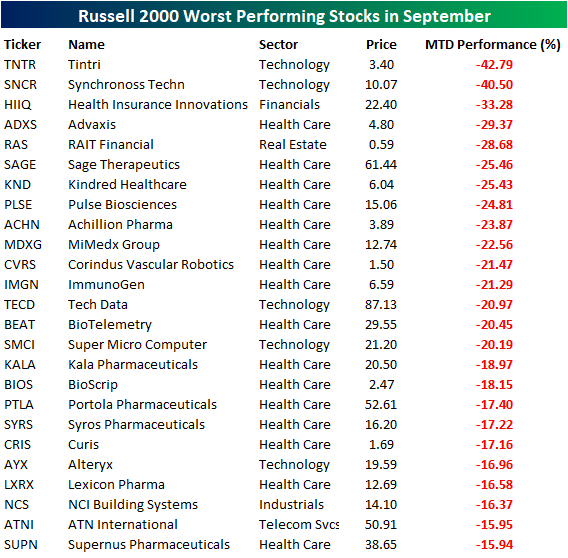
To the downside, over 500 stocks in the Russell 2000 are down so far this month, and of those 71 are down over 10%. The table below lists the 25 of those that are down the most. Leading the way to the downside, shares of Tintri (TNTR) have lost over 40% of their value after the company lowered guidance earlier this month. Close on the heels of TNTR, shares of Synchronoss (SNCR) are also down over 40% and all of that decline came on Tuesday when Siris Capital said it was no longer interested in acquiring the company. Here again, the majority of the names listed below are probably names you’ve never heard of, which is a good thing because the less familiar you are with these names, the less likely it is that you have been impacted by their declines.
On a final note, looking at both the lists of biggest winners and losers really drives home the point about how volatile stocks in the Health Care sector can be. In both the list of biggest winners and biggest losers, stocks from the Health Care sector make up over half of the names on the list with 13 on the list of biggest winners and 16 of the biggest losers.
Bespoke’s Global Macro Dashboard — 9/20/17
Bespoke’s Global Macro Dashboard is a high-level summary of 22 major economies from around the world. For each country, we provide charts of local equity market prices, relative performance versus global equities, price to earnings ratios, dividend yields, economic growth, unemployment, retail sales and industrial production growth, inflation, money supply, spot FX performance versus the dollar, policy rate, and ten year local government bond yield interest rates. The report is intended as a tool for both reference and idea generation. It’s clients’ first stop for basic background info on how a given economy is performing, and what issues are driving the narrative for that economy. The dashboard helps you get up to speed on and keep track of the basics for the most important economies around the world, informing starting points for further research and risk management. It’s published weekly every Wednesday at the Bespoke Institutional membership level.
Click here for a special $1 introductory Bespoke Institutional membership rate.

The Closer — Housing, Trade Prices, & The Current Account: 61 Charts To Browse — 9/19/17
Log-in here if you’re a member with access to the Closer.
Looking for deeper insight on global markets and economics? In tonight’s Closer sent to Bespoke Institutional clients, we chart residential construction data updated by the US Census today, also reviewing import and export prices and the Q2 current account balance.
The Closer is one of our most popular reports, and you can sign up for a free trial below to see it!
See today’s post-market Closer and everything else Bespoke publishes by starting a no-obligation 14-day free trial to our research platform!