S&P 500 Quickview Chartbook: 9/22/17
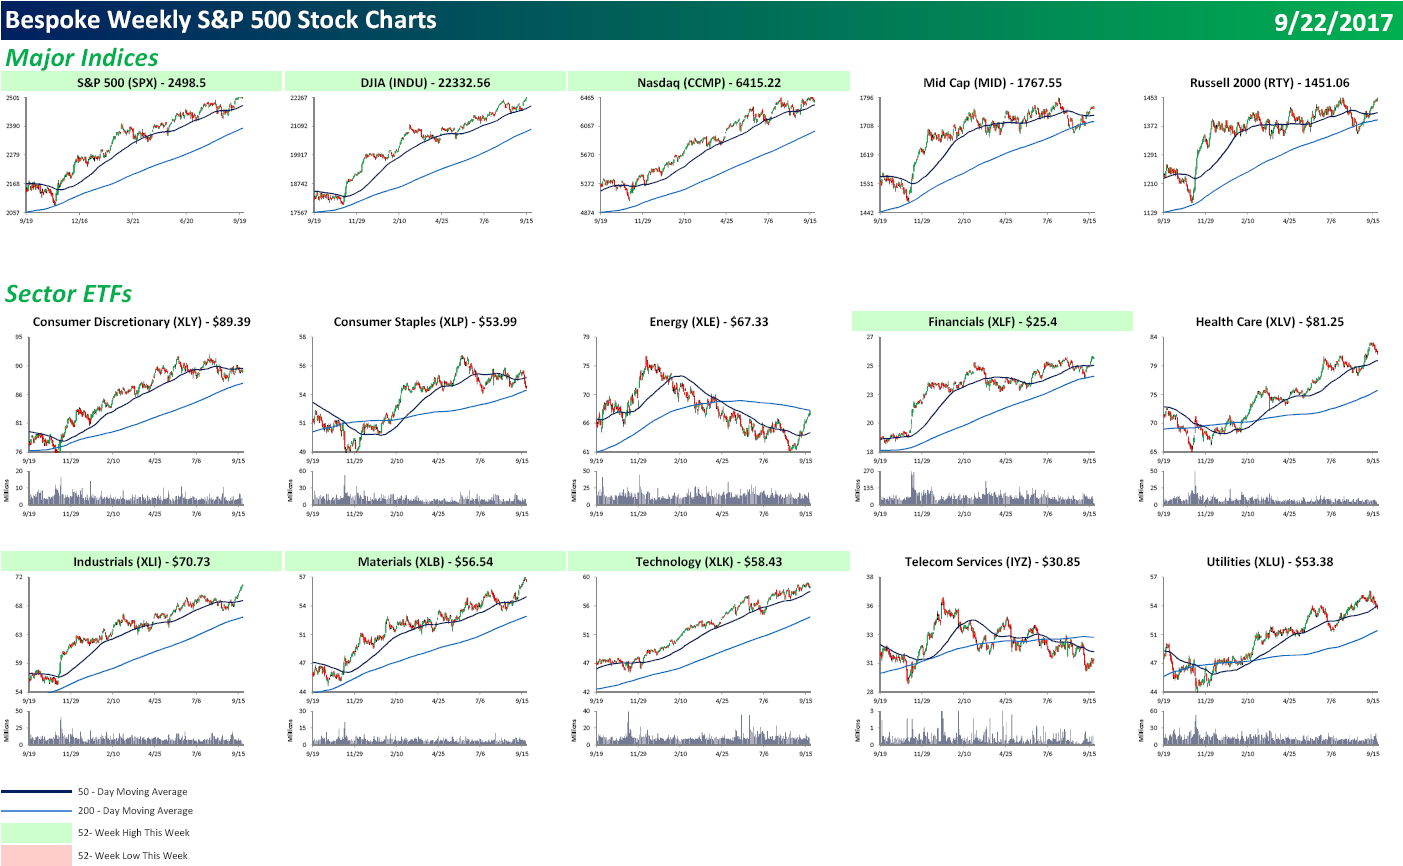
Each weekend as part of our Bespoke Premium and Institutional research service, clients receive our S&P 500 Quick-View Chart Book, which includes one-year price charts of every stock in the S&P 500. You can literally scan through this report in a matter of minutes or hours, but either way, you will come out ahead knowing which stocks, or groups of stocks, are leading and lagging the market. The report is a great resource for both traders and investors alike. Below, we show the front page of this week’s report which contains price charts of the major averages and ten major sectors.
To see this week’s entire S&P 500 Chart Book, sign up for a 14-day free trial to our Bespoke Premium research service.
Technicals Don’t Always Work Out the Way You Would Expect
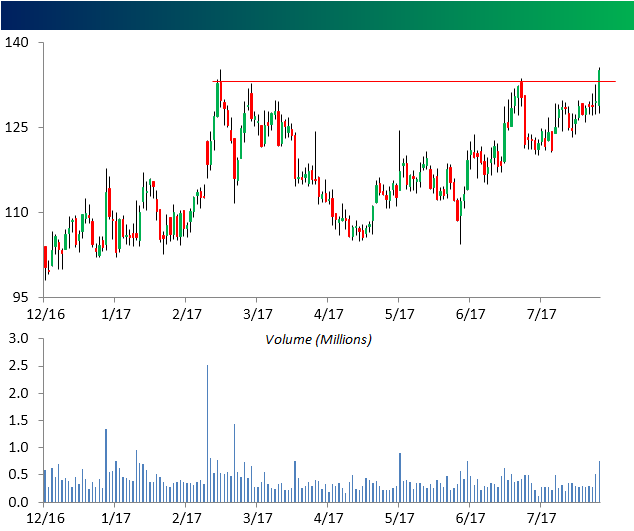
Take a look at the chart below. Without knowing the name, would you buy it? The chart looks pretty good. At the most recent trading day shown, the stock broke out above resistance to a new medium-term high. Not only that, but volume on the day of the breakout was also strong, coming in at twice its 50-day average. From a technical perspective, you really couldn’t ask for much more; just buy it and let it ride.
Gain access to 1 month of any of Bespoke’s membership levels for $1!
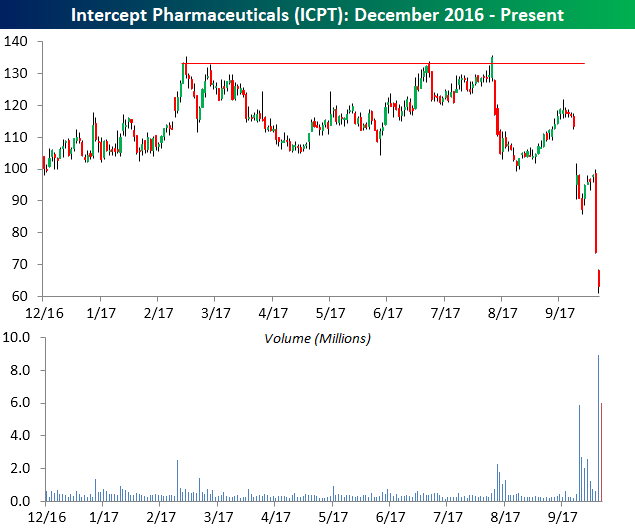
Like just about every other investing discipline, though, technicals aren’t infallible. In fact, sometimes they not only get it wrong, but very wrong. The chart above was the price chart of Intercept Pharmaceuticals (ICPT) from December 2016 through July 28th. If you had bought the stock based on that breakout and held through today, it would have been a very bad trade. Below we have updated the chart through early trading today. From its close on 7/28 through today, shares of ICPT have been more than cut in half with a decline of 53%. The moral of the story is two-fold. First, no investing discipline works all of the time, and second, whenever you enter a trade, you should always go in with an exit plan just in case things go wrong.
iPhone Search Trends
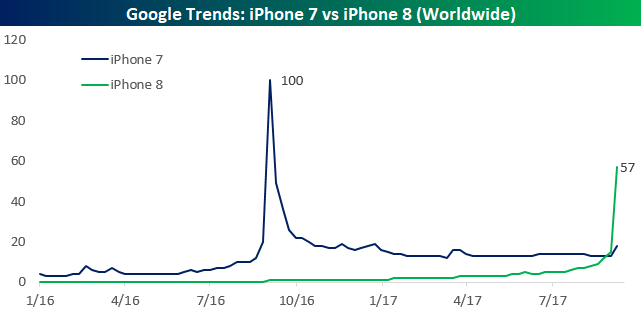
Today is a big day for Apple enthusiasts, as the iPhone 8 and iPhone 8 Plus models go on sale today. For Apple (AAPL) stock, though, it hasn’t been a particularly happy time, as initial reports and short lines outside stores suggest overall demand for the 8 models will be lighter than prior releases. One way to track interest in the iPhone 8 is to look at Google search trends for the iPhone 8 compared to the iPhone 7 when it was first released. We would have looked back further at comparisons to other models, but Google changed its data collection methods in early 2016, so any search results prior to then do not provide an apples to apples comparison (no pun intended).
The chart below compares search results between the iPhone 7, which was released last September, and the iPhone 8. Looking at the chart, search trends for the iPhone 7 really dwarfed the current search trends for the iPhone 8. Back in 2016, search trends for the 7 peaked right around the time the phone was first unveiled in early September. For the iPhone 8, the spike in search activity hasn’t been nearly as strong as the iPhone 7.
Gain access to 1 month of any of Bespoke’s membership levels for $1!
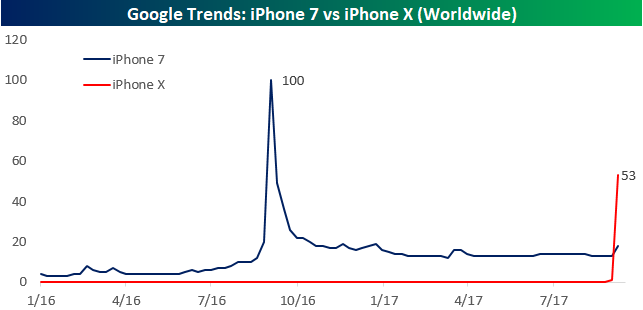
At first glance, the above chart looks like horrible news for Apple and supports the idea that sales trends for the new model, which goes on sale today, will be weaker than other models. What this line of reasoning misses, though, is that this time around Apple is releasing two different iPhone models. The chart below compares Google search trends for the iPhone 7 and the iPhone X. Here again, peak search trends for the iPhone 7 dwarf the iPhone X, but what is notable is that search trends for the X have been nearly as strong as the 8. Obviously, search trends don’t translate to actual sales, but it is noteworthy that consumers are searching for the iPhone X nearly as often as they are searching for the iPhone 8 even though sales for the iPhone X are expected to be much lower than sales of the iPhone 8.
Combining the search results for both the iPhone 8 and iPhone X and comparing it to the search trends for the iPhone 7 provides some encouraging results for Apple. Here, results for these two models actually exceeded the peak search results for the iPhone 7 by a margin of 10%.

Finally, another way to gauge the overall strength/momentum of the iPhone is to simply look at search results for the iPhone over time. Here again, search trends for iPhone remain positive and are currently higher now than they were last September with the release of the iPhone 7.
Gain access to 1 month of any of Bespoke’s membership levels for $1!

B.I.G. Tips – CAT: Sales Purring, Stock Rabid
The Closer — Fun With Flow of Funds — 9/21/17
Log-in here if you’re a member with access to the Closer.
Looking for deeper insight on global markets and economics? In tonight’s Closer sent to Bespoke Institutional clients, we chart the quarterly data from the Fed’s Flow of Funds (Z.1) report.

The Closer is one of our most popular reports, and you can sign up for a free trial below to see it!
See today’s post-market Closer and everything else Bespoke publishes by starting a no-obligation 14-day free trial to our research platform!
Bespoke’s Sector Snapshot — 9/21/17
We’ve just released our weekly Sector Snapshot report (see a sample here) for Bespoke Premium and Bespoke Institutional members. Please log-in here to view the report if you’re already a member. If you’re not yet a subscriber and would like to see the report, please start a 30-day trial to Bespoke Premium now.
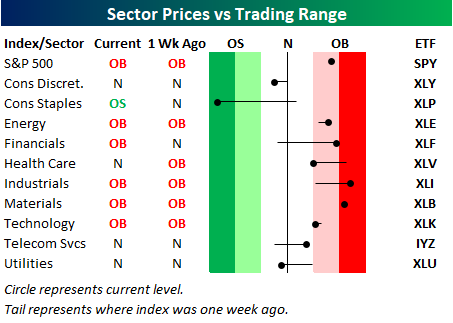
Below is one of the many charts included in this week’s Sector Snapshot, which shows our trading range screen for the S&P 500 and ten major sectors. The dot represents where each sector is currently trading, while the tail end represents where it was trading one week ago. The black vertical “N” line represents each sector’s 50-day moving average. Moves into the red zone are considered “overbought,” while moves into the green zone are considered “oversold.”
As shown, the S&P 500 and five sectors remain in overbought territory, but three sectors are now below their 50-day moving averages as we approach the end of the week. Note that the Consumer Staples sector has really been beaten down into extreme oversold territory.
To see our full Sector Snapshot with additional commentary plus six pages of charts that include analysis of valuations, breadth, technicals, and relative strength, start a 30-day free trial to our Bespoke Premium package now. Here’s a breakdown of the products you’ll receive.
Chart of the Day: Recession Timers In For A Wait
ETF Trends: US Indices & Styles – 9/21/17
Philly Fed Exceeds Expectations
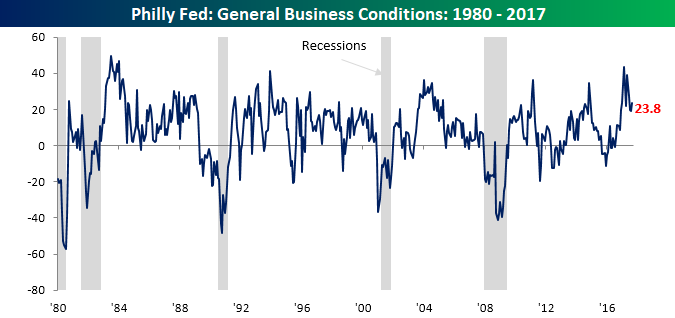
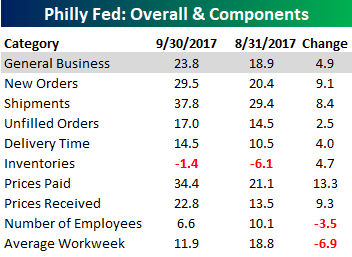
It has been a positive day for economic data today as all three major indicators released topped expectations. One of the better-than-expected reports was the Philly Fed Manufacturing Index, which rebounded after three straight months of declines. While economists were forecasting the headline print to come in at a level of 17.1, the actual reading came in at 23.8.
Gain access to 1 month of any of Bespoke’s membership levels for $1!
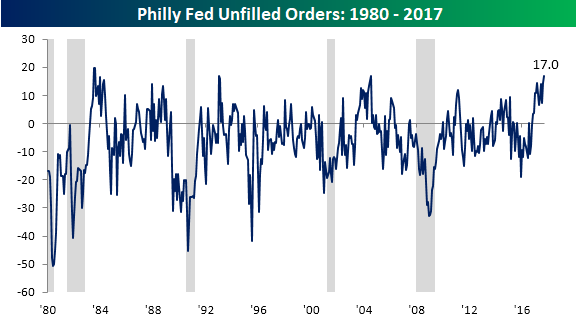
Looking at the components of the September report, the internals were generally strong. As shown in the table below, seven of the nine components showed sequential increases while the two employment-related categories were the only ones that were down. The biggest increase on the month was Prices Paid (13.3), followed by Prices Received (9.3), New Orders (9.1), and Shipments (8.4). One notable category was Unfilled Orders. At a level of +17.0, the component registered its highest level since August 1983 (chart below)! All in all, a good report.
the Bespoke 50 — 9/21/17
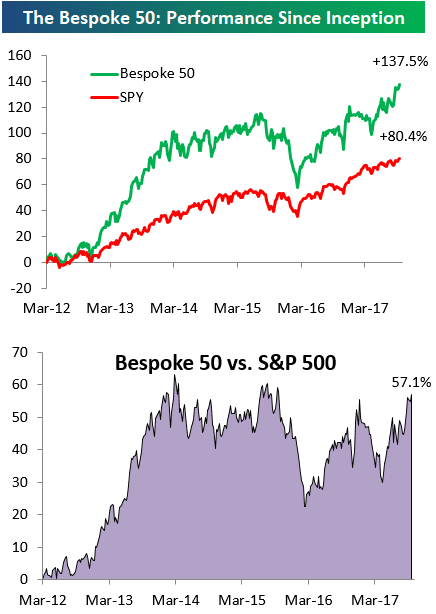
Every Thursday, Bespoke publishes its “Bespoke 50” list of top growth stocks in the Russell 3,000. Our “Bespoke 50” portfolio is made up of the 50 stocks that fit a proprietary growth screen that we created a number of years ago. Since inception in early 2012, the “Bespoke 50” has beaten the S&P 500 by 57.1 percentage points. Through today, the “Bespoke 50” is up 137.5% since inception versus the S&P 500’s gain of 80.4%. Always remember, though, that past performance is no guarantee of future returns.
To view our “Bespoke 50” list of top growth stocks, sign up for Bespoke Premium ($99/month) at this checkout page and get your first month free. This is a great deal!