Bespoke’s Sector Snapshot — 9/28/17
We’ve just released our weekly Sector Snapshot report (see a sample here) for Bespoke Premium and Bespoke Institutional members. Please log-in here to view the report if you’re already a member. If you’re not yet a subscriber and would like to see the report, please start a 30-day trial to Bespoke Premium now.
Below is one of the many charts included in this week’s Sector Snapshot, which shows our trading range screen for the S&P 500 and ten major sectors. The dot represents where each sector is currently trading, while the tail end represents where it was trading one week ago. The black vertical “N” line represents each sector’s 50-day moving average. Moves into the red zone are considered “overbought,” while moves into the green zone are considered “oversold.”
As shown, the S&P 500 and six sectors are in overbought territory, while two sectors — Consumer Discretionary and Utilities — are oversold.

To see our full Sector Snapshot with additional commentary plus six pages of charts that include analysis of valuations, breadth, technicals, and relative strength, start a 30-day free trial to our Bespoke Premium package now. Here’s a breakdown of the products you’ll receive.
B.I.G. Tips – October 2017 Seasonality
ETF Trends: Fixed Income, Currencies, and Commodities – 9/28/17
Chart of the Day: Markets Still Not Optimistic On Tax Reform
the Bespoke 50 — 9/28/17
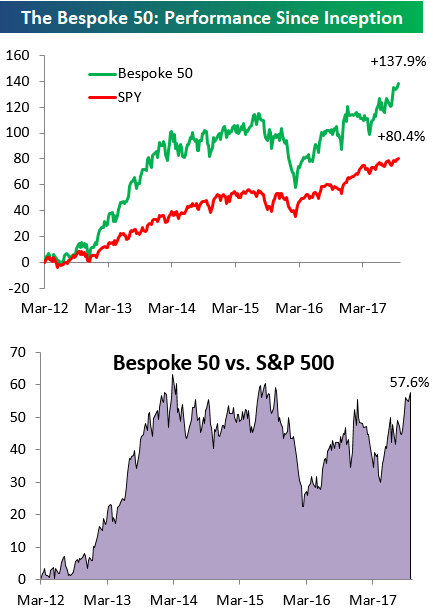
Every Thursday, Bespoke publishes its “Bespoke 50” list of top growth stocks in the Russell 3,000. Our “Bespoke 50” portfolio is made up of the 50 stocks that fit a proprietary growth screen that we created a number of years ago. Since inception in early 2012, the “Bespoke 50” has beaten the S&P 500 by 57.6 percentage points. Through today, the “Bespoke 50” is up 137.9% since inception versus the S&P 500’s gain of 80.4%. Always remember, though, that past performance is no guarantee of future returns.
To view our “Bespoke 50” list of top growth stocks, sign up for Bespoke Premium ($99/month) at this checkout page and get your first month free. This is a great deal!
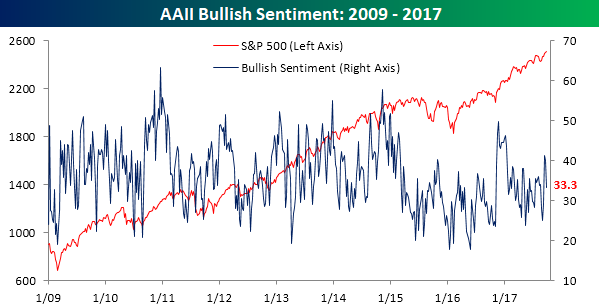
Bullish Sentiment Pulls Back
After two weeks of peeking above 40%, bullish sentiment pulled back sharply this week. According to the weekly survey from AAII, bullish sentiment pulled in from 40.14% last week to 33.33%. That’s the largest one-week decline since mid-May. At the risk of sounding like a broken record, bullish sentiment has now been below 50% for a record 143 straight weeks.
Gain access to 1 month of any of Bespoke’s membership levels for $1!
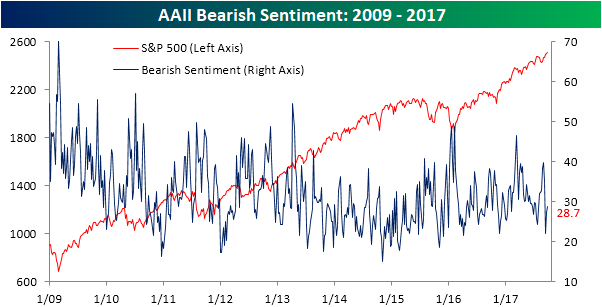
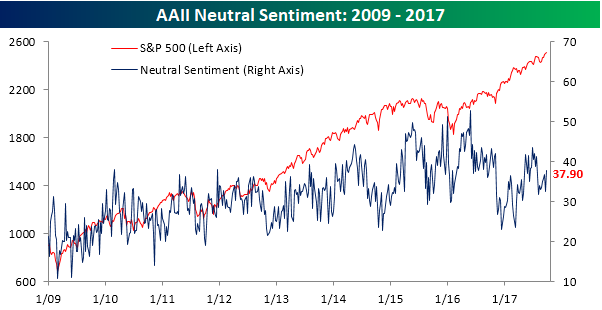
While bullish sentiment pulled back, bearish sentiment barely increased as it rose from 27.2% up to just 28.7%. Thie big increase this week came in neutral sentiment where the undecideds rose from 32.7% up to 37.9%, which is the highest level since late July.
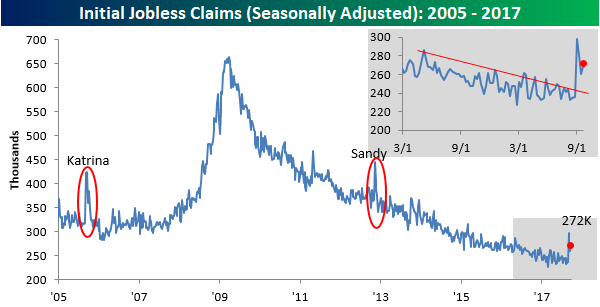
Jobless Claims Defy Nature
Jobless claims for the latest week came in slightly ahead of forecasts, rising from 260K up to 272K. According to the DoL release, “Hurricanes Harvey and Irma [and Maria] impacted this week’s claims.” While it will be a few more weeks before claims are fully back to their normal trend, when you consider the impact that Katrina and Sandy had back in 2005 and 2012, the fact that claims never got above 300K this time around is really something else. This year we’ve seen three major hurricanes impact US states or territories. With the streak remaining intact, jobless claims have now been under 300K for 134 straight weeks.
Gain access to 1 month of any of Bespoke’s membership levels for $1!
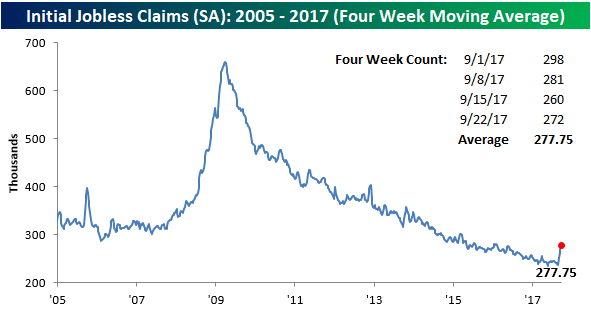
While weekly claims are pulling in from their recent highs, the impacts of the hurricanes on the four-week moving average are still being felt. In this week’s report, the four-week moving average increased to 277.75K, which is the highest reading for that indicator since January 2016. But even this should start pulling in again next week.
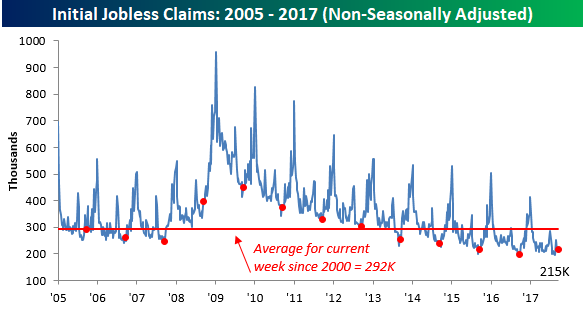
Non-seasonally adjusted claims have also been strong despite the hurricanes. This week’s print increased to 215K from 213K and is 77K below the average for the current week of the year going back 2000. In fact, going back to 1967, claims have only been lower in the current week of the year six other times and only once since 1973. We can only imagine how low claims might have been without the major hurricanes over the last six weeks.
The Closer — Poloz Punishes, Dancing Durables, Foreign Gasoline — 9/27/17
Log-in here if you’re a member with access to the Closer.
Looking for deeper insight on global markets and economics? In tonight’s Closer sent to Bespoke Institutional clients, we discuss the outlook for USDCAD ahead of monthly GDP Friday and in the wake of Governor Poloz’s speech today. We also review durable goods activity reported by the Census today and recap petroleum market data from the EIA.

The Closer is one of our most popular reports, and you can sign up for a free trial below to see it!
See today’s post-market Closer and everything else Bespoke publishes by starting a no-obligation 14-day free trial to our research platform!