the Bespoke 50 — 10/5/17
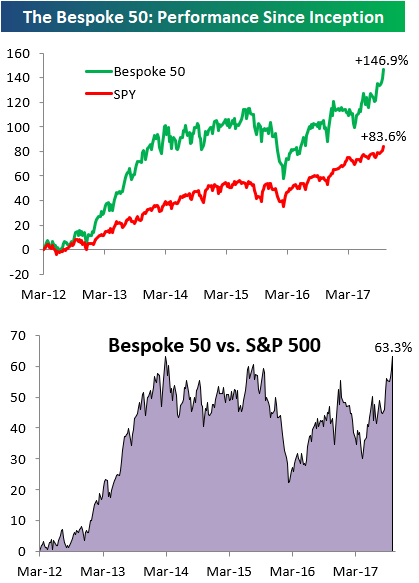
Every Thursday, Bespoke publishes its “Bespoke 50” list of top growth stocks in the Russell 3,000. Our “Bespoke 50” portfolio is made up of the 50 stocks that fit a proprietary growth screen that we created a number of years ago. Since inception in early 2012, the “Bespoke 50” has beaten the S&P 500 by 63.3 percentage points. Through today, the “Bespoke 50” is up 146.9% since inception versus the S&P 500’s gain of 83.6%. Always remember, though, that past performance is no guarantee of future returns.
To view our “Bespoke 50” list of top growth stocks, sign up for Bespoke Premium ($99/month) at this checkout page and get your first month free. This is a great deal!
B.I.G. Tips – September Employment Report Preview
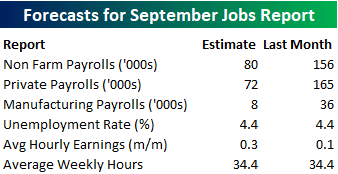
Heading into Friday’s Non Farm Payrolls (NFP) report for September, economists are expecting an increase in payrolls of 80K, which would be a huge 76K decline from last month’s weaker than expected reading of 156K. In the private sector, economists are expecting an even larger decline to 72K from 165K. Even with the slower job growth, the unemployment rate is forecasted to remain at an exceptionally low level of 4.4%. Growth in average hourly earnings is expected to accelerate to 0.3%, while average weekly hours worked is also forecast to remain unchanged at 34.4. While the job creation figures are forecasted to show a major slowdown, it is all due to the hurricanes that hit the south during late August and early September.
Ahead of the report, we just published our eleven-page monthly preview for the September jobs report. This report contains a ton of analysis related to how the equity market has historically reacted to the monthly jobs report, as well as how secondary employment-related indicators we track looked in August. We also include a breakdown of how the initial reading for August typically comes in relative to expectations and how that ranks versus other months.
One topic we cover in each month’s report is the S&P 500 stocks that do best and worst from the open to close on the day of the employment report based on whether or not the report comes in stronger or weaker than expected. In other words, which stocks should you buy, and which should you avoid? The table below highlights the best-performing stocks in the S&P 500 from the open to close on days when the Non-Farm Payrolls report has been better than expected over the last two years. Of the 25 top performing stocks on days when the NFP beats expectations, six sectors are represented, with Energy leading the way with seven. Leading the way to the upside, both Vornado (VNO) and Qorvo (QRVO) have seen average open to close gains of over 2%. In terms of consistency, Urban Outfitters (URBN), Skyworks (SWKS), Autodesk (ADSK), and Albermarle (ALB) have been in the black 92% of the time.
For anyone with more than a passing interest in how equities are impacted by economic data, this report is a must-read. To see the report, sign up for a monthly Bespoke Premium membership now!

US Stock Market Up 60%+ From Prior All-Time Highs
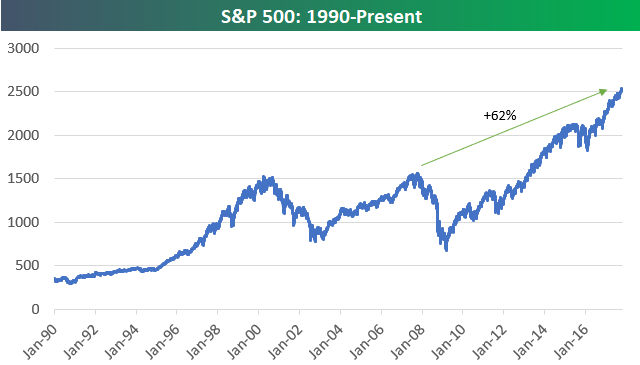
The long-term price chart for major US equity indices continues to amaze. Below are charts of the large-cap S&P 500 and Wilshire 5,000 (all US stocks) going back to 1990. At this point, the S&P 500 is up 62% from the all-time high it made back in 2007 prior to the Financial Crisis. The index needs to get just above 3,000 to mark a “double” from its prior highs.
The Wilshire 5,000 is up even more from its prior bull market high made in 2007 at +67%.
Gain access to 1 month of any of Bespoke’s premium membership levels for $1!

While the price chart for the S&P 500 shows huge gains versus prior all-time highs, things aren’t nearly as strong for global equity markets. As shown below, the Bloomberg World Index (which still has a big US weighting) is indeed at new all-time highs, but it’s up just 13% from its 2007 bull market high.

And emerging markets aren’t even at new highs compared to 2007. As shown below, the EEM ETF is still down 18%!
If you had to choose between US equities and international equities, which asset class will perform better over the next ten years?
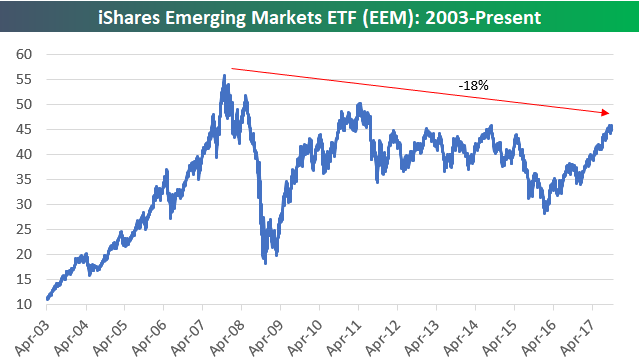
Chart of the Day: Biotech At A Crossroads
Bear and Bulls Both on the Rise
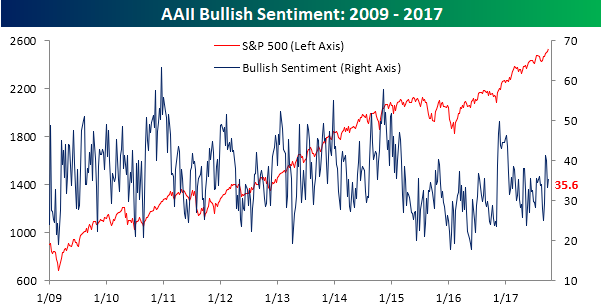
Bullish sentiment on the part of individual investors saw a slight uptick this week, but with the S&P 500 up for seven straight days, that was to be expected. What is a bit surprising is the fact that barely more than a third of investors consider themselves bullish at this point. According to the weekly survey from AAII, bullish sentiment increased to 35.6%, and for those keeping score at home, it is the 144th straight week where bulls have been out of the majority.
Gain access to 1 month of any of Bespoke’s premium membership levels for $1!
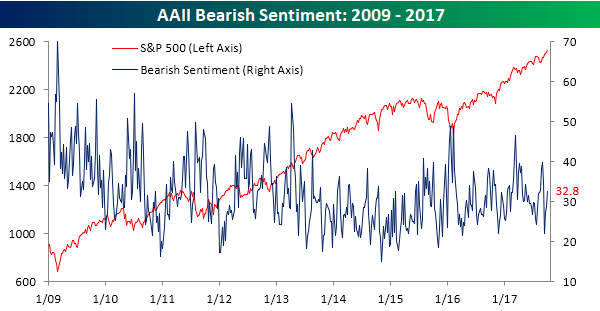
Even more surprising than the small increase in bullish sentiment following seven straight up days was the relatively large increase in bearish sentiment which increased from 28.7% up to 32.8%.
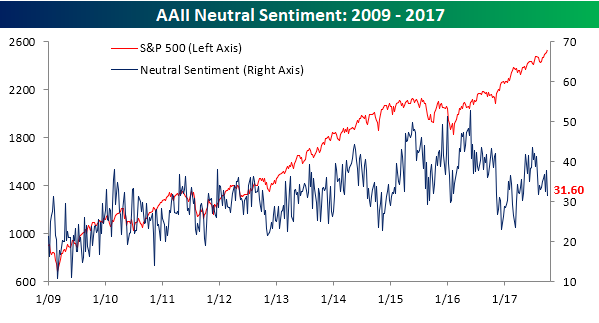
With bullish and bearish sentiment both on the increase, neutral sentiment fell from 37.9% down to 31.6%, and that’s the lowest level since April.
Bespoke Consumer Pulse Shows September Sentiment Surge
Each month, Bespoke runs a survey of 1,500 US consumers balanced to census. In the survey, we cover everything you can think of regarding the economy, personal finances, and consumer spending habits. We’ve now been running the monthly survey for more than three years, so we have historical trend data that is extremely valuable, and it only gets more valuable as time passes. All of this data gets packaged into our monthly Bespoke Consumer Pulse Report, which is included as part of our Pulse subscription package that is available for either $39/month or $365/year. We highly recommend trying out the service, as it includes access to model portfolios and additional consumer reports as well. If you’re not yet a Pulse member, click here to start a 30-day free trial now!
Our September 2017 Pulse report was recently published, and it showed a big surge in a number of economic readings on a month-over-month and year-over-year basis. After a summer slowdown, our newest Pulse report suggests that we’re in the midst of another uptick in the economy.
Below is a heatmap included in our Pulse report that summarizes changes in the major economic categories covered in our monthly survey. Green is indicative of strength, and as you can see, there’s a lot of it this month!

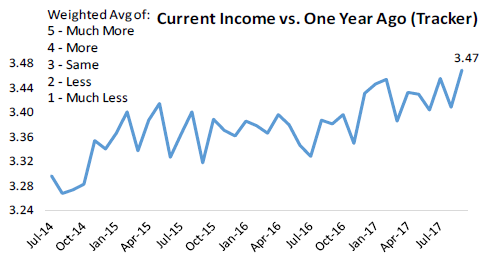
Below are charts that show the results of two questions we ask consumers on a monthly basis. The first asks respondents how their current income compares to their income from a year ago. As you can see, this reading made a new multi-year high in September, suggesting that consumers are flush with spending money as we approach the holiday months.
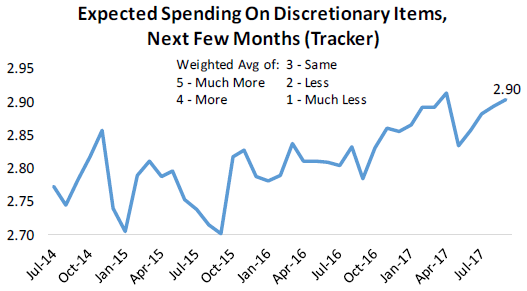
And consumers do plan on spending their additional income, as evidenced by the second chart below which asks about expected spending on discretionary items over the next few months.
To see our full economic Pulse report for September, click here to start a 30-day free trial now!
Jobless Claims Drop More Than Expected
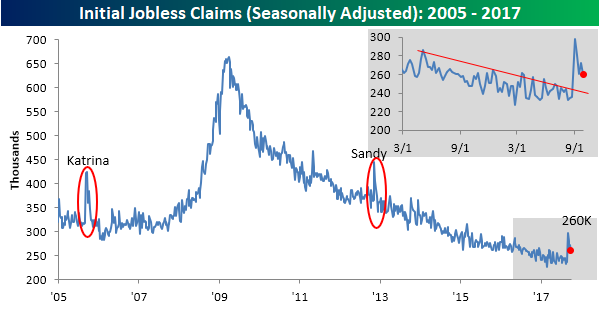
Weekly jobless claims are still feeling the impact of the late summer HIM-icanes (Harvey, Irma, and Maria), but the worst of the impact is over, and it wasn’t nearly as bad as we saw back in 2005 with Katrina and 2012 with Sandy. According to the Department of Labor, first-time claims dropped from 272K down to 260K, which was below the consensus forecast of 265K. This now makes it 135 straight weeks that jobless claims have been below 300K. While claims never did spike as much as they did with prior big hurricanes, the return back to trend seems to be taking a bit longer as well, but that could be the impact of three hurricanes hitting different parts of the country as opposed to the prior single storms hitting one region.
Gain access to 1 month of any of Bespoke’s premium membership levels for $1!
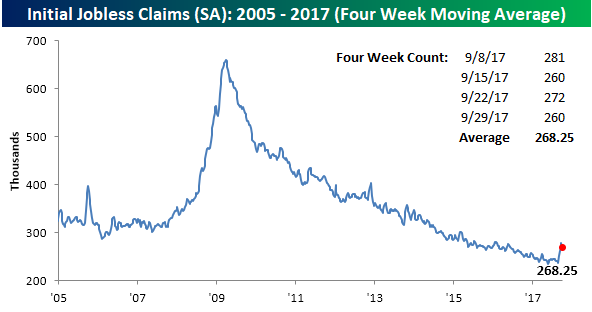
On a four-week moving average basis, claims dropped from 277.75K down to 268.25K. That decline of 9.5K was the largest single-week decline in the four-week average since March 2015.
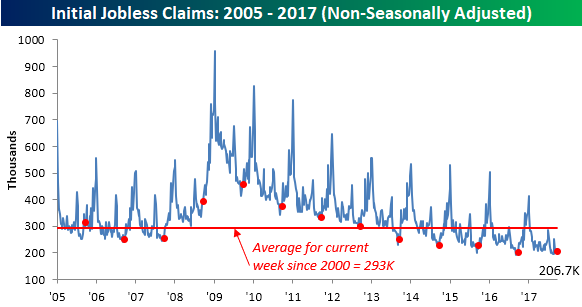
On a non-seasonally adjusted (NSA) basis, jobless claims dropped to 206.7K from 215K. That’s more than 85K below the average for the current week of the year dating back to 2000, but actually above the level we saw in the same week last year. Here again, though, the weather definitely played a role.
The Closer — Correlation Crash, EIA Review — 10/4/17
Log-in here if you’re a member with access to the Closer.
Looking for deeper insight on global markets and economics? In tonight’s Closer sent to Bespoke Institutional clients, we take a look at plunging correlations and review EIA data on the petroleum market updated today.

The Closer is one of our most popular reports, and you can sign up for a free trial below to see it!
See today’s post-market Closer and everything else Bespoke publishes by starting a no-obligation 14-day free trial to our research platform!
Bespoke Consumer Pulse Report — September 2017
Bespoke’s Consumer Pulse Report is an analysis of a huge consumer survey that we run each month. Our goal with this survey is to track trends across the economic and financial landscape in the US. Using the results from our proprietary monthly survey, we dissect and analyze all of the data and publish the Consumer Pulse Report, which we sell access to on a subscription basis. Sign up for a 30-day free trial to our Bespoke Consumer Pulse subscription service here. With a trial, you’ll get coverage of consumer electronics, social media, streaming media, retail, autos, and much more. The report also has numerous proprietary US economic data points that are extremely timely and useful for investors.
