B.I.G. Tips – Decile Analysis Highlights Rotation Underway
Chart of the Day: Economic Surprises Pile On
Fixed Income Weekly – 11/29/17
Searching for ways to better understand the fixed income space or looking for actionable ideals in this asset class? Bespoke’s Fixed Income Weekly provides an update on rates and credit every Wednesday. We start off with a fresh piece of analysis driven by what’s in the headlines or driving the market in a given week. We then provide charts of how US Treasury futures and rates are trading, before moving on to a summary of recent fixed income ETF performance, short-term interest rates including money market funds, and a trade idea. We summarize changes and recent developments for a variety of yield curves (UST, bund, Eurodollar, US breakeven inflation and Bespoke’s Global Yield Curve) before finishing with a review of recent UST yield curve changes, spread changes for major credit products and international bonds, and 1 year return profiles for a cross section of the fixed income world.
In this week’s note, we review the performance of auto loan securitizations.

Our Fixed Income Weekly helps investors stay on top of fixed income markets and gain new perspective on the developments in interest rates. You can sign up for a Bespoke research trial below to see this week’s report and everything else Bespoke publishes free for the next two weeks!
Click here and start a 14-day free trial to Bespoke Institutional to see our newest Fixed Income Weekly now!
Bespoke’s Global Macro Dashboard — 11/29/17
Bespoke’s Global Macro Dashboard is a high-level summary of 22 major economies from around the world. For each country, we provide charts of local equity market prices, relative performance versus global equities, price to earnings ratios, dividend yields, economic growth, unemployment, retail sales and industrial production growth, inflation, money supply, spot FX performance versus the dollar, policy rate, and ten year local government bond yield interest rates. The report is intended as a tool for both reference and idea generation. It’s clients’ first stop for basic background info on how a given economy is performing, and what issues are driving the narrative for that economy. The dashboard helps you get up to speed on and keep track of the basics for the most important economies around the world, informing starting points for further research and risk management. It’s published weekly every Wednesday at the Bespoke Institutional membership level.
You can access our Global Macro Dashboard by starting a 14-day free trial to Bespoke Institutional now!

The Closer — Tax Progress, Strong Data — 11/28/17
Log-in here if you’re a member with access to the Closer.
Looking for deeper insight on markets? In tonight’s Closer sent to Bespoke Institutional clients, we take a look at the impact of tax reform progress made today by the GOP, review strong data across the global economy, break down the monthly Richmond Fed activity indices, and review the acceleration in US home prices.

The Closer is one of our most popular reports, and you can sign up for a free trial below to see it!
See today’s post-market Closer and everything else Bespoke publishes by starting a 14-day free trial to Bespoke Institutional today!
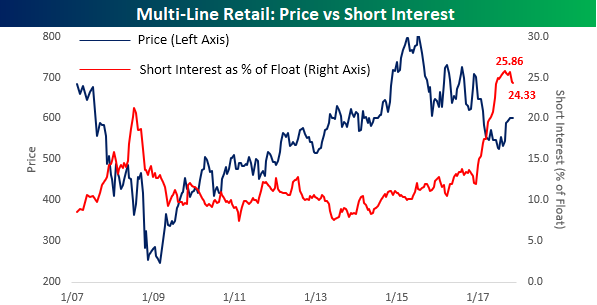
Slightly Less Bearish on Multi-Line Retailers
If there’s one area of the market that investors couldn’t be more bearish on, it’s the multi-line retailers. With Amazon eating their lunch, consumers changing the way they spend money (choosing experiences over stuff), and an overall bloated retail footprint, multi-line retailers have faced a perfect storm and their stocks have reacted accordingly. With all the negative headwinds, short-sellers have been piling on the group. At the end of 2016, average short interest as a percentage of float for the group was an already high 14.3%, but through the course of the year, short interest levels ballooned to more than 25%. Shorting retail stocks has become one of the consensus trades of 2017. The trade has become so consensus, in fact, that ProShares imitated (to put it kindly) our Death by Amazon Index and created an ETF that increases in price when the stocks of traditional brick and mortar retailers decline.
In recent weeks, however, we have begun to see some easing in the pressure by short sellers towards traditional brick and mortar retailers. The chart below compares the S&P 500 Multi-Line Retail Index to the average short interest (as a percentage of float) of multi-line retailers in the S&P 1500. While the average SIPF level of stocks in the group peaked at 25.86% at the end of August, in four of the last five short interest reports, the average has declined. Granted, it’s not much of a drop and it has coincided with a rally in the stocks, but it’s the first time we have seen such consistent declines in short interest for the group all year.
US Style ETFs Trending Higher But Overbought
Bespoke’s “ETF Trends” tool is one of our most popular products available to Bespoke Premium and Bespoke Institutional members. Our ETF Trends tool helps investors find available ETFs to purchase (or sell) across asset classes. More importantly, our proprietary Trend and Timing scores help investors determine whether the timing is right based on each ETF’s historical trading patterns. To start using our ETF Trends tool now, start a 14-day free Premium or Institutional trial today!
Below is a snapshot of today’s “US Styles” category from our ETF Trends tool. As you can see, our proprietary Trend indicator shows that every single ETF in this category is in an uptrend (based on a 6-month price chart). All but two ETFs are currently overbought (OB) versus their 50-day moving averages as well. (In our trading range screen, the black vertical “N” line represents each ETF’s 50-day moving average, while the dot represents where the ETF is currently trading. The tail end represents where it was trading one week ago.)
The across-the-board “overbought” readings indicate that the US stock market is once again extended to the upside. So even though these ETFs are trading in long-term uptrends (a good thing), their Timing scores are mostly Neutral or Poor. This means that investors looking to add exposure to these ETFs might want to wait for a pullback to more “normal” trading levels.
Only two ETFs in this category currently have “Good” Timing scores — the Russell 2,000 Value ETF (IWN) and the Buyback Achievers ETF (PKW). Both of these ETFs are currently in uptrends but they’re not currently trading overbought.
To view and interact with other categories of our ETF Trends tool, start a 14-day free Premium or Institutional trial today!

Bespoke Short Interest Report — 11/28/17
Short interest figures for the middle of November were released after the close on Tuesday, so we have just updated our regular report on short interest trends for the market, sectors, and individual stocks for clients. Below we wanted to quickly highlight the stocks with the highest levels of short interest as a percentage of float. The list below shows the 23 stocks in the S&P 1500 that have more than a third of their free-floating shares sold short. Through yesterday’s close, the 23 stocks listed below have risen an average of 2.31% (median: 1.23%) compared to the 1.03% gain for the S&P 1500. So, there hasn’t been much of a performance disparity in either direction.
Of the 23 names listed, 13 are up so far this month with the largest gains coming from Bristow Group (BRS), Lannett (LCI), and Carbo Ceramics (CRR), which are each up over 20%. To the downside, there have also been some big losers with stocks like Frontier Communications (FTR), Red Robin Gourmet (RRGB), and 3D Systems all down over 25%.
In terms of sector representation, over a third of the 23 stocks listed below are from the Consumer Discretionary sector. Of those nine, the most shorted stock is Shake Shack, which has over 60% of its float sold short. The interesting thing about SHAK is that despite the fact that short interest has and continues to be exceptionally high, the stock has been relatively stable, trading in a range between $30 and $40 for the last year.
For a more detailed look at short interest data on a regular basis, sign up for a monthly Bespoke Premium membership now!
