The Closer — Capex Comeback, No Fiscal Fecundity — 10/25/17
Log-in here if you’re a member with access to the Closer.
Looking for deeper insight on global markets and economics? In tonight’s Closer sent to Bespoke Institutional clients, we discuss US investment spending, government contribution to growth, and new home sales data updated today.

The Closer is one of our most popular reports, and you can sign up for a free trial below to see it!
See today’s post-market Closer and everything else Bespoke publishes by starting a 14-day free trial to Bespoke Institutional today!
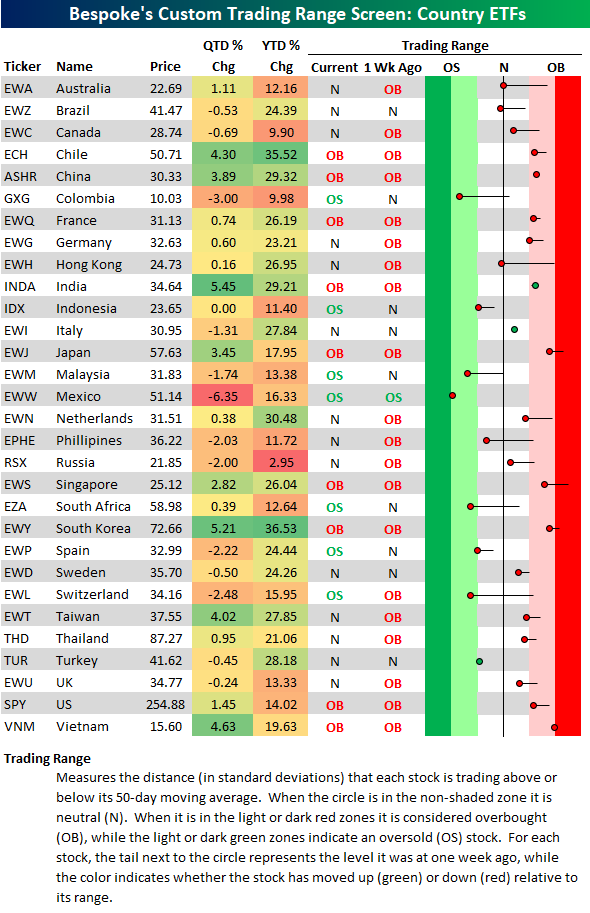
Global Equities Pulling Back
US equity markets have been on a pretty epic run over the past few weeks, but today the major indices are finally pulling back a bit. We’re seeing mean reversion in international equity markets as well. You can see the pullback in our Country Trading Range Screen below. The screen highlights where each of the 30 largest country ETFs (traded on US exchanges) are trading relative to their 50-day moving averages (the black vertical “N” line in the screen). The dot represents where each ETF is currently trading relative to its range, while the tail end shows where it was trading a week ago. A red dot means the ETF is down within its range over the last week, and vice versa for a green dot.
As you can see, there are only three green dots versus twenty-seven red dots, so we’ve pretty much seen across-the-board mean reversion for global equities over the last week. There were twenty countries that were trading in overbought (OB) territory last week at this time, but now there are only nine. And there are now seven countries in oversold territory versus just one last week.
Countries like Australia (EWA), Brazil (EWZ), Colombia (GXG), Hong Kong (EWH), the Philippines (EPHE), South Africa (EZA), and Switzerland (EWL) all broke below their 50-days over the last week.
Short Interest Report – 10/25/17
ETF Trends: US Indices & Styles – 10/25/17
Chart of the Day: Semis – Knocking Your SOX Off
Fixed Income Weekly – 10/25/17
Searching for ways to better understand the fixed income space or looking for actionable ideals in this asset class? Bespoke’s Fixed Income Weekly provides an update on rates and credit every Wednesday. We start off with a fresh piece of analysis driven by what’s in the headlines or driving the market in a given week. We then provide charts of how US Treasury futures and rates are trading, before moving on to a summary of recent fixed income ETF performance, short-term interest rates including money market funds, and a trade idea. We summarize changes and recent developments for a variety of yield curves (UST, bund, Eurodollar, US breakeven inflation and Bespoke’s Global Yield Curve) before finishing with a review of recent UST yield curve changes, spread changes for major credit products and international bonds, and 1 year return profiles for a cross section of the fixed income world.
In this week’s note, we review changing bidder behavior in long-term Treasury auctions and shifts in ownership of the UST market.
Our Fixed Income Weekly helps investors stay on top of fixed income markets and gain new perspective on the developments in interest rates. You can sign up for a Bespoke research trial below to see this week’s report and everything else Bespoke publishes free for the next two weeks!
Click here and start a 14-day free trial to Bespoke Institutional to see our newest Fixed Income Weekly now!
Looking For Action? S&P 1500 Most Volatile Stocks
For traders with a short-term time horizon who are looking for big moves over a short period, we have updated our list of the S&P 1500 stocks trading above $10 that have the largest intraday high-low ranges (based on the average percent spread between the intraday high and low over the last 50 days). The stocks are grouped based on whether they have a rising or falling 50-day moving average (DMA). Stocks highlighted in gray are new to the list this month.
With overall market volatility near record lows, it shouldn’t come as a surprise that there is not a whole lot of major volatility in individual stocks. As shown in the table below, just ten stocks in the S&P 1500 have an average daily intraday move of over 5%. Neck and neck in the lead for the title of most volatile stock are shares of MiMedx (MDXG) and Finish Line (FINL), which are both in short-term downtrends and have seen average daily moves of 6.4%. The only other stock in the S&P 1500 that has seen an average intraday move of 6% is Impax Labs (IPXL). While all three of the stocks mentioned have relatively low share prices, the highest priced stock on the list is RH (formerly Restoration Hardware). With a price of around $86 per share, the stock sees an average daily intraday move of nearly $4 each day.
In terms of sector representation, Health Care is the most heavily represented with twelve stocks and Consumer Discretionary is right on its heels with eleven. The only sector not represented is Utilities, but that shouldn’t be a surprise given the sector’s traditionally stable investor base.

Bespoke’s Global Macro Dashboard — 10/25/17
Bespoke’s Global Macro Dashboard is a high-level summary of 22 major economies from around the world. For each country, we provide charts of local equity market prices, relative performance versus global equities, price to earnings ratios, dividend yields, economic growth, unemployment, retail sales and industrial production growth, inflation, money supply, spot FX performance versus the dollar, policy rate, and ten year local government bond yield interest rates. The report is intended as a tool for both reference and idea generation. It’s clients’ first stop for basic background info on how a given economy is performing, and what issues are driving the narrative for that economy. The dashboard helps you get up to speed on and keep track of the basics for the most important economies around the world, informing starting points for further research and risk management. It’s published weekly every Wednesday at the Bespoke Institutional membership level.
You can access our Global Macro Dashboard by starting a 14-day free trial to Bespoke Institutional now!

The Closer — Trade, PMIs & Richmond Fed Concur: Upward Bound Output — 10/24/17
Log-in here if you’re a member with access to the Closer.
Looking for deeper insight on global markets and economics? In tonight’s Closer sent to Bespoke Institutional clients, we review August global trade volumes, October flash Manufacturing PMI data, and Richmond Fed Manufacturing and Services activity data.
The Closer is one of our most popular reports, and you can sign up for a free trial below to see it!
See today’s post-market Closer and everything else Bespoke publishes by starting a 14-day free trial to Bespoke Institutional today!