Bespokecast Episode 19 — Eddy Elfenbein — Now Available on iTunes, GooglePlay, Stitcher and More
 Our newest episode of Bespokecast is now available! Be sure to subscribe to Bespokecast on your preferred podcast app to gain access to our full collection of episodes. We’d also love for you to provide a review as well!
In this episode of Bespokecast, we talk to the author of Crossing Wall Street Eddy Elfenbein. Eddy is an investor, portfolio manager, market commentator, and picks the stocks in the portfolio of CWS, the actively managed AdvisorShares Focused Equity ETF. Eddy’s popular Buy List is a simple portfolio of 25 equal-weighted stocks designed to outperform the S&P 500, which it has done in 8 of the last 11 years. Eddy takes an avid interest in history and current events, and he joined us from his home in Washington, DC for an hour long conversation about the markets.
To listen to our newest episode or subscribe to the podcast via iTunes, GooglePlay, OvercastFM, or Stitcher, please click the button or links below. Please note that third-party podcast feeds may update at a lag of a few hours to this blog post.

B.I.G. Tips – Year Like 2017: December Edition
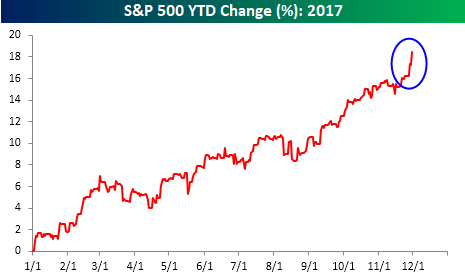
Heading into Thanksgiving, investors were already thankful for a great year in the equity market, but this week the S&P 500 has taken things into a higher gear with a performance that would even make bitcoin proud. A key catalyst for this week’s move has been the increased prospects of a tax reform package getting passed, proving the point we have been making for some time now that tax reform getting done was not already fully priced into the market.
So how does the 18%+ return for the S&P 500 in the first eleven months of the year stack up against prior years, and based on how equities have performed in the first eleven months of 2017, can we expect more of the same to close things out, or will the bulls run out of gas?
In our most recently released B.I.G. Tips report, we looked at years that had the most similar trading pattern to 2017 to see what trends the December performance of the S&P 500 in those years had in common. This helps give us an idea of what to expect for the remainder of the year. This report is a must-read. To see it, sign up for a monthly Bespoke Premium membership now!
Bespoke’s Sector Snapshot — 11/30/17
We’ve just released our weekly Sector Snapshot report (see a sample here) for Bespoke Premium and Bespoke Institutional members. Please log-in here to view the report if you’re already a member. If you’re not yet a subscriber and would like to see the report, please start a two-week free trial to Bespoke Premium now.
Below is one of the many charts included in this week’s Sector Snapshot, which highlights our trading range screen for the S&P 500 and ten sectors. The dot represents where each sector is currently trading in its range, and as shown, all but three sectors are currently trading well into overbought (OB) territory. The Financial sector (XLF) is at the most extreme levels — trading 3 standard deviations above its 50-day moving average.

To see our full Sector Snapshot with additional commentary plus six pages of charts that include analysis of valuations, breadth, technicals, and relative strength, start a two-week free trial to our Bespoke Premium package now. Here’s a breakdown of the products you’ll receive.
B.I.G. Tips – December 2017 Seasonality
Another 1,000 Point Dow Threshold Bites the Dust
While all the attention shifted towards bitcoin and the pace with which it traded up through different 1,000 point price levels, the DJIA just reminded investors that it too has been on quite a run. With the index on pace to close above 24,000 for the first time today, that now makes it six 1,000 point thresholds that the DJIA has crossed for the first time since last November’s Election.
The table below lists the first day that the DJIA closed above each 1,000 point threshold beginning with 1,000 way back in 1972. Obviously, the higher the index goes, the less of a percentage move each successive threshold becomes, but the recent pace has still been quick. Even more impressive is the fact that for each of the recent thresholds the DJIA has crossed, it hasn’t dipped back below very often. In fact, since last November’s election, no single 1,000 point threshold has been crossed (on a closing basis) up or down more than five times.
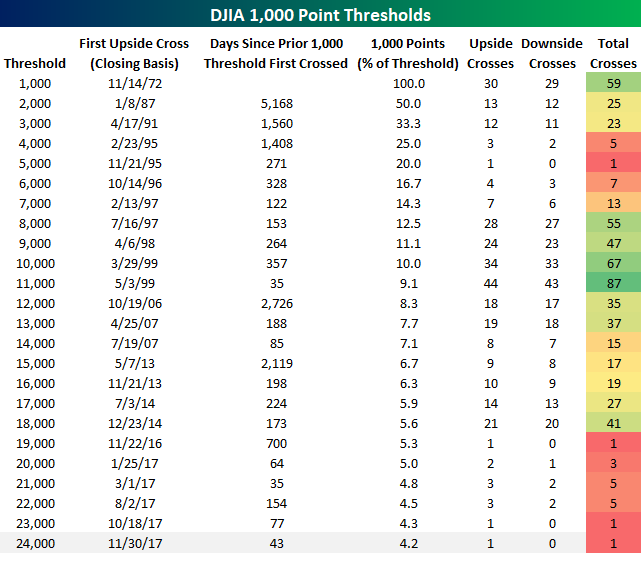
Chart of the Day: Express Scripts (ESRX) Too Cheap To Ignore
the Bespoke 50 — 11/30/17
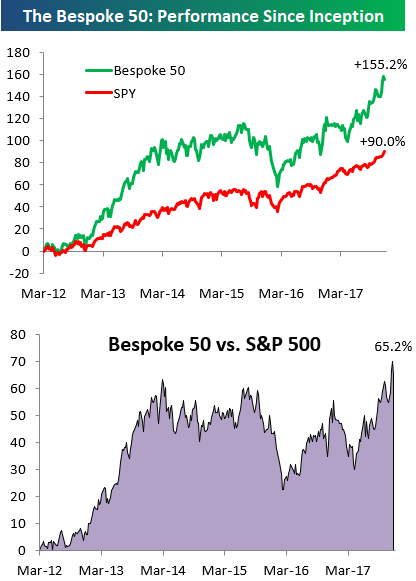
Every Thursday, Bespoke publishes its “Bespoke 50” list of top growth stocks in the Russell 3,000. Our “Bespoke 50” portfolio is made up of the 50 stocks that fit a proprietary growth screen that we created a number of years ago. Since inception in early 2012, the “Bespoke 50” has beaten the S&P 500 by 65.2 percentage points. Through today, the “Bespoke 50” is up 155.2% since inception versus the S&P 500’s gain of 90.0%. Always remember, though, that past performance is no guarantee of future returns.
To view our “Bespoke 50” list of top growth stocks, click the button below and start a trial to either Bespoke Premium or Bespoke Institutional.
Jobless Claims Slightly Lower Than Expected
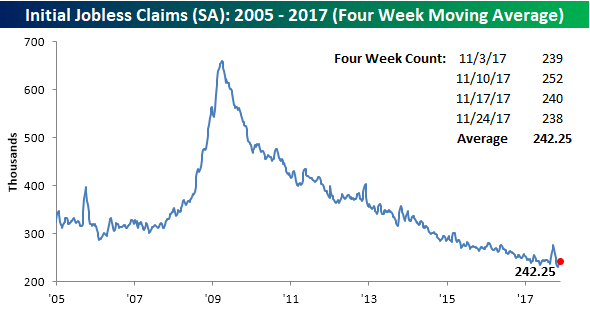
Like just about everything these days (besides bitcoin), there was very little volatility in this week’s jobless claims report as first-time claims fell by 2K to 238K compared to expectations for 240K. There’s not much new to say here as jobless claims continue to be one of the most consistent indicators of strength in the US economy. This week’s print marked the 143rd straight week where claims were below 300K, which is pretty incredible.
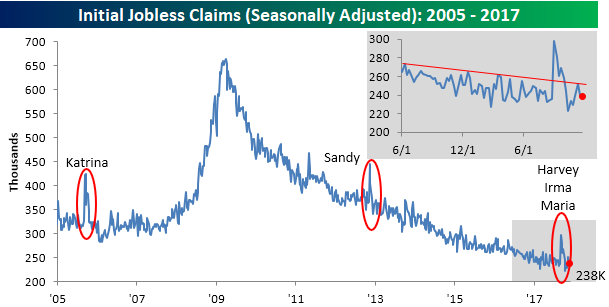
Even though this week’s print showed a slight decline, the four-week moving average actually ticked higher rising from 239.75K up to 242.25K. That now puts this reading 11K higher than the multi-decade cycle low of 231.25K that we saw four weeks ago.
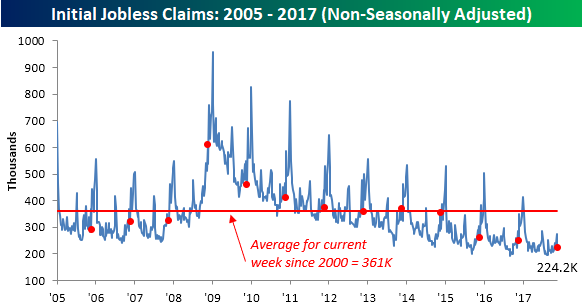
The most impressive aspect of this week’s report was the non-seasonally adjusted reading which declined from 274.2K down to 224.2K. For the current week of the year, NSA claims are more than 130K below their average since 2000 and haven’t been this low at this time of year since 1968!
The Closer — Rotation, Rotation, Rotation — 11/29/17
Log-in here if you’re a member with access to the Closer.
Looking for deeper insight on markets? In tonight’s Closer sent to Bespoke Institutional clients, we look at the massive rotation that has hit US equity markets this week. One area of the market that has seen huge buying interest recently is retail. Below is a list of our Death By Amazon index members. For each stock, we show its year-to-date percentage change along with its percentage change this week. On average, Death By Amazon stocks are down 15% year-to-date, but they’re up 8.2% this week. That’s a massive move. Of the 62 stocks in the index, 19 are up more than 10% on the week.
We discuss this week’s rotation in more detail in tonight’s Closer.

See today’s post-market Closer and everything else Bespoke publishes by starting a 14-day free trial to Bespoke Institutional today!
B.I.G. Tips – Nasdaq Underperforms For a Change
It was a rare painful day for the Nasdaq on Wednesday as the index fell more than 1% even as the DJIA traded up over 0.4%. For an index that was up close to 30% on the year heading into the day, Wednesday’s decline seemed even more extreme.
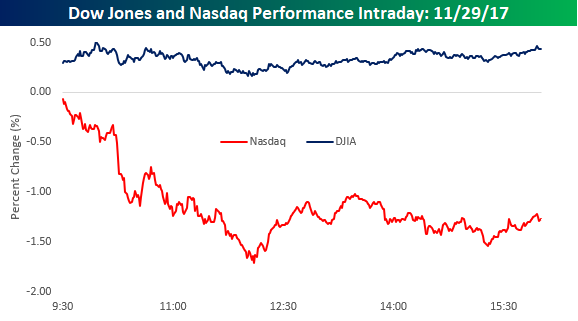
There haven’t been too many times in recent history where we have seen a similar divergence between the Nasdaq and DJIA. In fact, Wednesday was only the 7th time during the current bull market (since March 2009) where the DJIA was up on the day while the Nasdaq traded down over 1%. In our most recently released B.I.G. Tips report, we looked at how both the Nasdaq and DJIA performed following prior days where there were similar divergences. This report is a must-read. To see it, sign up for a monthly Bespoke Premium membership now!