S&P 500 Quick-View Chart Book — 10/27/17 — Lots of New Highs!
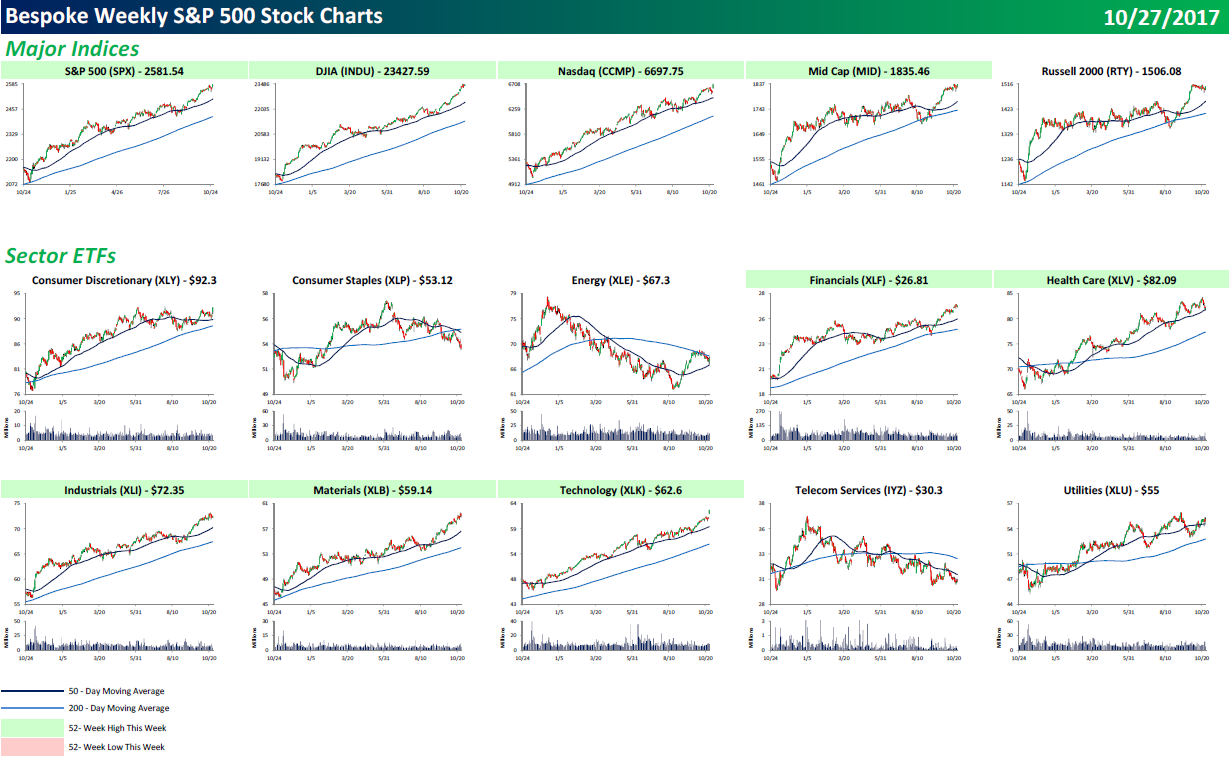
Each weekend as part of our Bespoke Premium and Institutional research service, clients receive our S&P 500 Quick-View Chart Book, which includes one-year price charts of every stock in the S&P 500. You can literally scan through this report in a matter of minutes or hours, but either way, you will come out ahead knowing which stocks, or groups of stocks, are leading and lagging the market. The report is a great resource for both traders and investors alike. Below we show the front page of this week’s report which contains price charts of the major averages and ten major sectors.
As seen in the charts below, the only major average that didn’t hit an all-time high this week was the Russell 2000, but it remains strong as well. In terms of individual sectors,we saw new highs from Financials, Health Care, Industrials, Materials, and Technology. The only cyclical sector that didn’t hit a new high was the brick-and-mortar-plagued Consumer Discretionary sector.
Make sure to check out our entire S&P 500 Chart Book by signing up for a 14-day free trial to our Bespoke Premium research service.
Technology Sector Weighting Explodes Higher
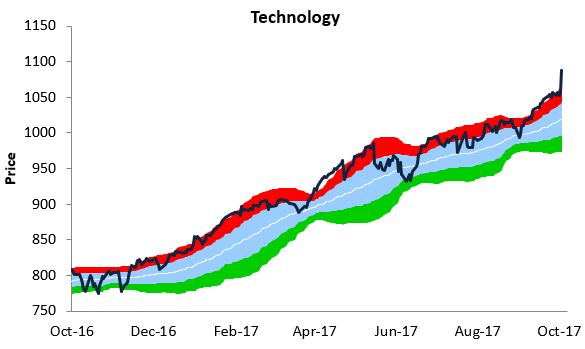
The S&P 500 Technology sector is up huge today, rallying 2.6% on a day when the S&P 500 as a whole is only marginally higher. As shown below, the sector has moved up into the stratosphere compared to its normal trading range. At this point in time, the sector is trading three standard deviations above its 50-day moving average. These kinds of overbought levels don’t last long, as either a pullback in price occurs or moving averages start to play catch up.
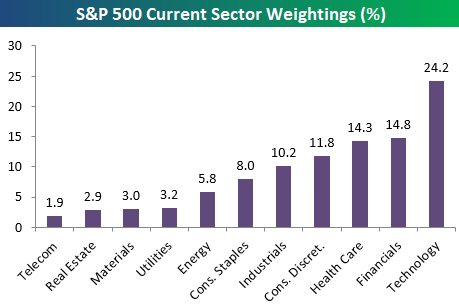
The move higher in the Tech sector has caused its weighting in the S&P 500 to balloon up to 24.2%. That’s almost ten percentage points larger than the 2nd largest sector in the S&P 500 — Financials. It’s also more than 12x as large as the smallest sector in the index — Telecom. Finally, Tech is now just as large as the smallest SIX sectors in the S&P.
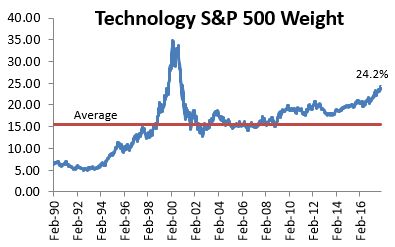
Below is a chart showing Tech’s weighting in the S&P 500 going back to 1990. You may not know it, but Tech was actually the SMALLEST sector in the S&P back in 1991. My how times have changed!
If it provides any comfort, while 24.2% is a huge weighting, keep in mind that it’s still 10 percentage points lower than the weighting Tech saw at the end of the Dot Com boom back in the late 1990s. At Tech’s peak back in March 2000, it had a record 34.81% weighting in the S&P. Even still, Tech’s weighting of 24.2% now was only seen for a few months at the very tail end of the Dot Com boom. It didn’t reach 24.2% until November 1999. At that point, the Tech Bubble only had four months to go before the epic crash occurred.
We know times are different now, but we definitely get a little uneasy when we see one sector taking up basically a quarter of the entire market. It’s not healthy in our view.
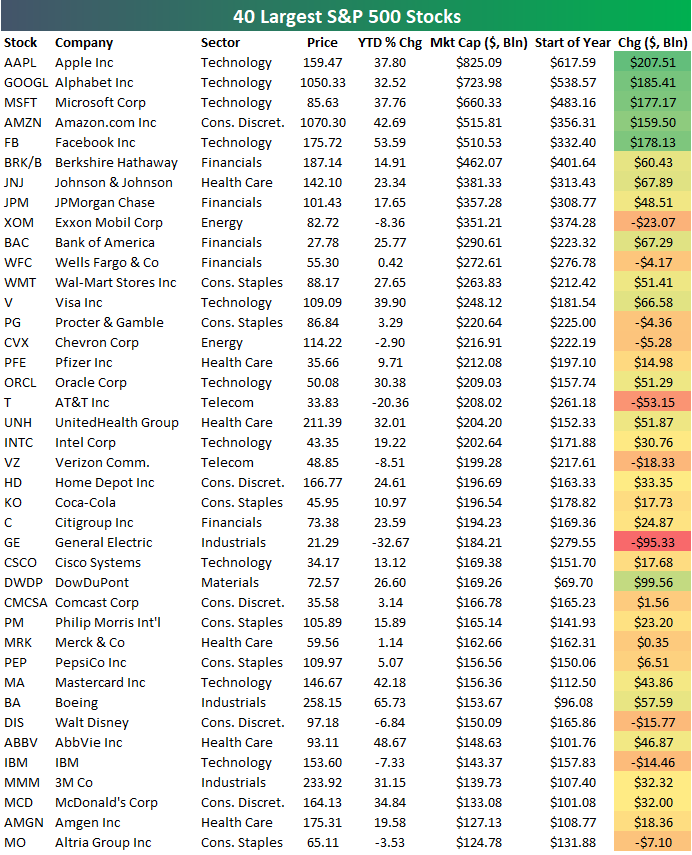
The Biggest Get Even Bigger
Below is a look at the 40 largest companies in the S&P 500. Today has been a big day for the largest companies in the world. They’re all trading higher on the back of strong earnings reports from Alphabet (GOOGL), Microsoft (MSFT), and Amazon (AMZN).
Apple (AAPL) remains in the lead as the largest public company in the world by more than $100 billion in market cap, but GOOGL is now worth $724 billion — larger than any company not named Apple has ever been.
The 3rd, 4th, and 5th largest companies in the S&P are now all worth more than $500 billion as well.
So far in 2017, the five largest companies — all Tech related names — have added close to a trillion in market cap. The remaining 495 stocks in the S&P 500 have added roughly 2 trillion. This means the five largest stocks have accounted for a third of the 2017 gains in market cap for the entire S&P 500.
The Closer — Capex Comeback, No Fiscal Fecundity — 10/26/17
Log-in here if you’re a member with access to the Closer.
Looking for deeper insight on global markets and economics? In tonight’s Closer sent to Bespoke Institutional clients, we discuss the goings on today in Catalonia, the ECB’s decision to trim stimulus, and the strong footing for the dollar.

The Closer is one of our most popular reports, and you can sign up for a free trial below to see it!
See today’s post-market Closer and everything else Bespoke publishes by starting a 14-day free trial to Bespoke Institutional today!
Bespoke’s Sector Snapshot — 10/26/17
We’ve just released our weekly Sector Snapshot report (see a sample here) for Bespoke Premium and Bespoke Institutional members. Please log-in here to view the report if you’re already a member. If you’re not yet a subscriber and would like to see the report, please start a two-week free trial to Bespoke Premium now.
Below is one of the many charts included in this week’s Sector Snapshot, which is our trading range chart for S&P 500 sectors. The black vertical “N” line represents each sector’s 50-day moving average, and as shown, 8 of 10 sectors are currently above their 50-days. We have seen a slight pullback over the past week for most sectors, though, with the biggest pullback coming from Health Care (XLV).

To see our full Sector Snapshot with additional commentary plus six pages of charts that include analysis of valuations, breadth, technicals, and relative strength, start a two-week free trial to our Bespoke Premium package now. Here’s a breakdown of the products you’ll receive.
Chart of the Day: Playing Two-Way Oil Flows
ETF Trends: Hedge – 10/26/17
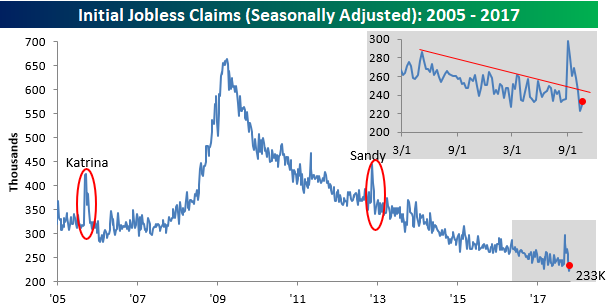
Jobless Claims Still Below Pre-Hurricane Levels
Jobless claims rose by 10K this week but still managed to come in slightly below consensus expectations (233K vs 235K). Claims have now been below 300K for 138 straight weeks, which is the longest such streak since the early 1970s. If Hurricanes Harvey, Irma, and Maria weren’t able to push claims above 300K, it’s hard to imagine what will.
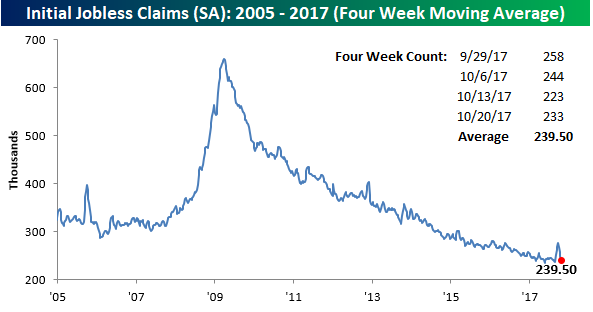
With the recently low string of weekly prints, the four-week moving average continues to sink. Even with this week’s 10K increase, the four-week moving average declined to 239.5K from 248.5K. That now puts this metric within 4K of the multi-decade low of 235.5K we saw back in May. Looking ahead to next week, as long as claims don’t increase by more than 8K, we should see a new low in the four-week moving average.
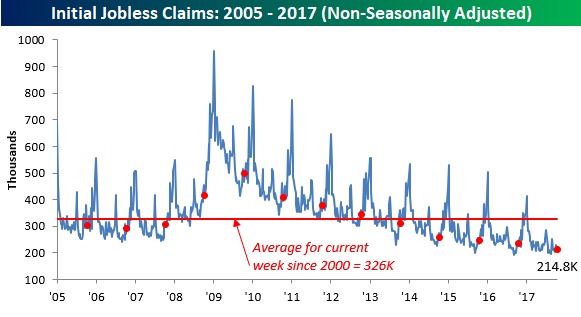
On a non-seasonally adjusted (NSA) basis, claims increased by 9.3K this week, but that is still well below typical levels for this time of year as the average reading for the current week of the year since 2000 is more than 110K higher at 325.75K. To find a week where claims were lower than this week’s print at this time of year, you have to go all the way back to 1973.
the Bespoke 50 — 10/26/17
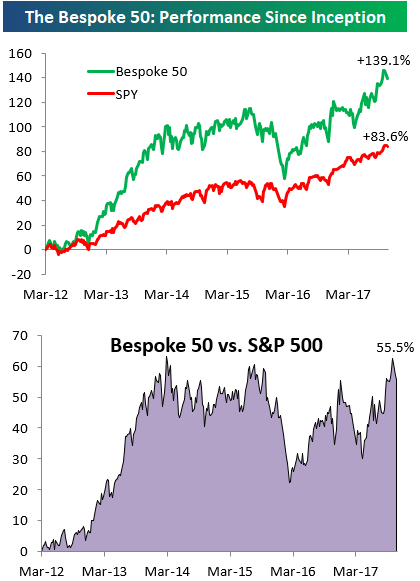
Every Thursday, Bespoke publishes its “Bespoke 50” list of top growth stocks in the Russell 3,000. Our “Bespoke 50” portfolio is made up of the 50 stocks that fit a proprietary growth screen that we created a number of years ago. Since inception in early 2012, the “Bespoke 50” has beaten the S&P 500 by 55.5 percentage points. Through today, the “Bespoke 50” is up 139.1% since inception versus the S&P 500’s gain of 83.6%. Always remember, though, that past performance is no guarantee of future returns.
To view our “Bespoke 50” list of top growth stocks, click the button below and start a trial to either Bespoke Premium or Bespoke Institutional.
Bullish Sentiment Approaches 40%
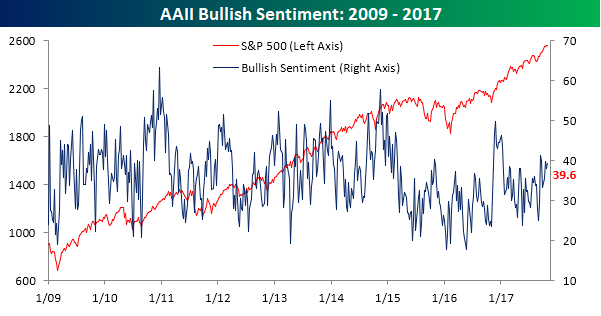
In normal times a bullish sentiment reading of 40% wouldn’t be much of a big deal, but given the state of sentiment over the last several years, 40% is now considered an accomplishment. In this week’s sentiment survey from AAII, bullish sentiment increased 1.7 percentage points up to 39.6%. That represents a five-week high, but also a record 147 straight weeks where bulls have failed to be in the majority.
While bullish sentiment may have ticked higher, bearish sentiment surged 5.1 percentage points to a seven-week high of 33.0%. 33% may not sound like much and it is lower than the 39.6% bullish reading, but when you consider the fact that stocks have been hitting record highs on a seemingly daily basis, it represents a healthy degree of skepticism.

With both the bull and bear camps expanding this week, fence sitters plummeted, falling 6.8 percentage points down to 27.3%. That was the largest weekly decline since August and is the lowest weekly reading since March.
