Fixed Income Weekly – 12/6/17
Searching for ways to better understand the fixed income space or looking for actionable ideals in this asset class? Bespoke’s Fixed Income Weekly provides an update on rates and credit every Wednesday. We start off with a fresh piece of analysis driven by what’s in the headlines or driving the market in a given week. We then provide charts of how US Treasury futures and rates are trading, before moving on to a summary of recent fixed income ETF performance, short-term interest rates including money market funds, and a trade idea. We summarize changes and recent developments for a variety of yield curves (UST, bund, Eurodollar, US breakeven inflation and Bespoke’s Global Yield Curve) before finishing with a review of recent UST yield curve changes, spread changes for major credit products and international bonds, and 1 year return profiles for a cross section of the fixed income world.
In this week’s note, we review the size of the cryptocurrency market relative to the money supply of traditional currencies.

Our Fixed Income Weekly helps investors stay on top of fixed income markets and gain new perspective on the developments in interest rates. You can sign up for a Bespoke research trial below to see this week’s report and everything else Bespoke publishes free for the next two weeks!
Click here and start a 14-day free trial to Bespoke Institutional to see our newest Fixed Income Weekly now!
Chart of the Day – Smart Money Indicator Hanging In There For S&P 500 and Nasdaq
Bespoke’s Global Macro Dashboard — 12/6/17
Bespoke’s Global Macro Dashboard is a high-level summary of 22 major economies from around the world. For each country, we provide charts of local equity market prices, relative performance versus global equities, price to earnings ratios, dividend yields, economic growth, unemployment, retail sales and industrial production growth, inflation, money supply, spot FX performance versus the dollar, policy rate, and ten year local government bond yield interest rates. The report is intended as a tool for both reference and idea generation. It’s clients’ first stop for basic background info on how a given economy is performing, and what issues are driving the narrative for that economy. The dashboard helps you get up to speed on and keep track of the basics for the most important economies around the world, informing starting points for further research and risk management. It’s published weekly every Wednesday at the Bespoke Institutional membership level.
You can access our Global Macro Dashboard by starting a 14-day free trial to Bespoke Institutional now!

The Closer — Retail Detail, Trade Update — 12/5/17
Log-in here if you’re a member with access to the Closer.
Looking for deeper insight on markets? In tonight’s Closer sent to Bespoke Institutional clients, we review fundamental and valuation data for the major industries within the S&P 500 Retail industry group. We also update tracking of the US trade balance.

See today’s post-market Closer and everything else Bespoke publishes by starting a 14-day free trial to Bespoke Institutional today!
Chart of the Day: Three Recent Top Earnings Triple Plays
Bespoke Stock Scores — 12/05/17
Regional ETFs See Big Pullback from Overbought Levels
Bespoke’s “ETF Trends” tool is one of our most popular products available to Bespoke Premium and Bespoke Institutional members. Our ETF Trends tool helps investors find available ETFs to purchase (or sell) across asset classes. More importantly, our proprietary Trend and Timing scores help investors determine whether the timing is right based on each ETF’s historical trading patterns. Watch this tutorial video we made explaining how to make the most out of it. To start using our ETF Trends tool now, start a 14-day free Premium or Institutional trial today!
Below is a snapshot of today’s “Regions” category from our ETF Trends tool. Last week at this time, nearly every region of the world saw equity markets at overbought levels. Today, though, pretty much every region is back in neutral territory after experiencing a pullback over the last five trading days. Given that all of these ETFs are in long-term uptrends, a pullback from overbought to neutral levels triggers a “good” Timing score.
Click here to learn more about how to use our popular ETF Trends tool.

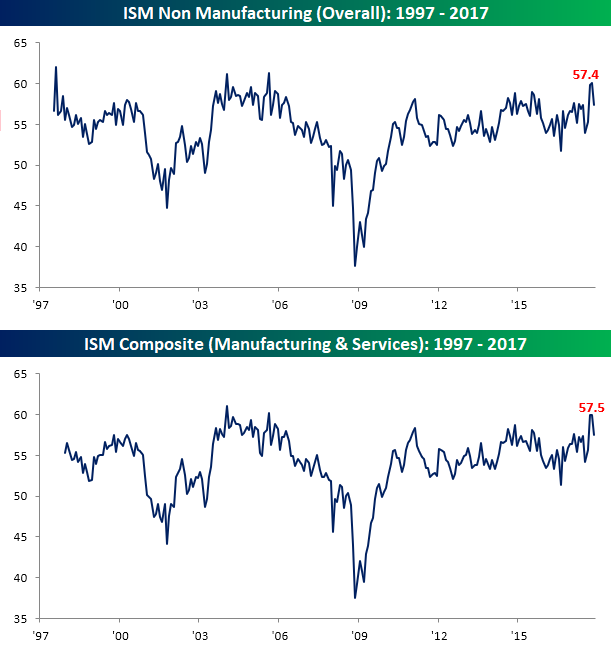
ISM Services Pull Back From a Multi-Year High
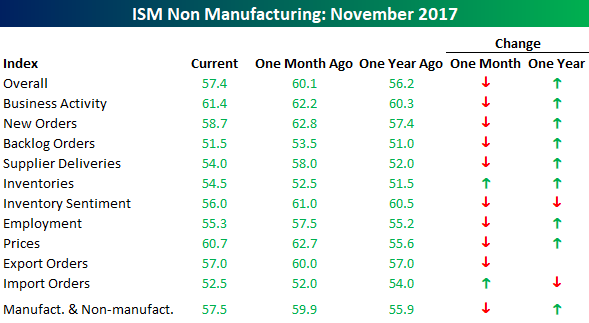
After hitting a 12-year high in October, sentiment in the services sector of the US economy pulled back a little more than expected in November. While economists were expecting November’s ISM Non-Manufacturing report to pull back from 60.1 to 59.0, the actual reading came in even weaker at 57.4. Taking this morning’s report and factoring in Thursday’s report on the Manufacturing sector, the combined ISM for November came in at 57.5 compared to 59.9 in October.
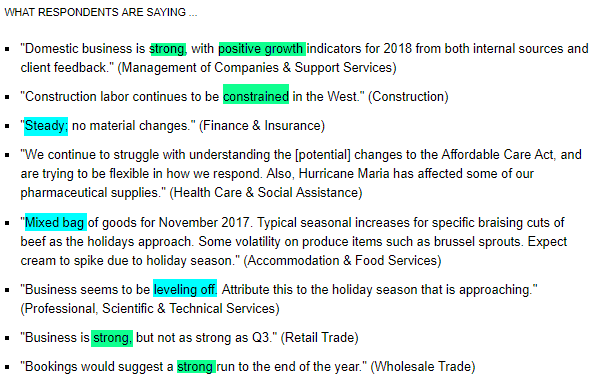
In a vacuum, the commentary section of this month’s report shows pretty widespread optimism, but if you’ve been reading these sections of the report on a regular basis, things aren’t quite as overwhelmingly positive as they have been in recent months.
Finally, the internals of this month’s report were, like the headline reading, weak on a m/m basis. As shown in the table below, the only components that showed a m/m increase in November were Inventories and Import Orders. To the downside, the biggest declines were in Inventory Sentiment, New Orders, and Supplier Deliveries. On a y/y basis, however, things still look very positive with Inventory Sentiment and Import Orders the only components that are down versus last November.
How Equity Returns Stack Up
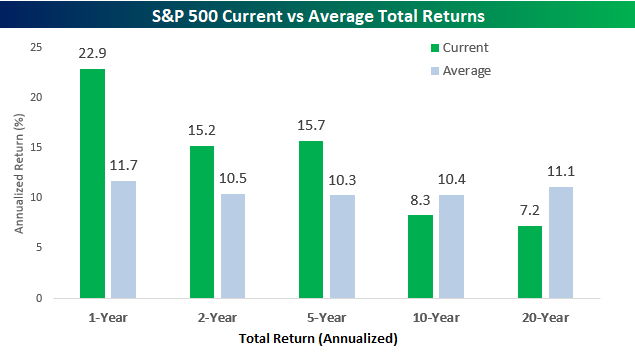
With the S&P 500 finishing November with a gain of 3.1% on a total return basis, the index saw its 13th straight month of gains. That’s right. Since last November’s election, US equities haven’t seen a down month, which is pretty remarkable when you think about it. With such continuous strength, the S&P 500’s total return over the last 12 months has been a gain of 22.9%, which is nearly double the historical average of 11.7%!
In the chart below, we have compared the S&P 500’s current one, two, five, ten, and twenty-year annualized total returns to their historical averages going back to the late 1920s. In the short to intermediate term, returns have been consistently above average with both the two and five-year annualized returns of over 15% exceeding the historical average by around five percentage points per year. Longer term, though, the impacts of the financial crisis and dot-com bust are still making their presence felt. Over the last ten years, the S&P 500’s 8.3% annualized return trails the historical average by about two percentage points, while the twenty-year annualized return of 7.2% trails the historical average of 11.1% by a pretty wide margin. The US equity market has obviously exited the dark ages of the early 2000s, but the scars, however faded they have become, are still there. Only time can heal.
The Closer — Energy, Trade, Manufacturing — 12/4/17
Log-in here if you’re a member with access to the Closer.
Looking for deeper insight on markets? In tonight’s Closer sent to Bespoke Institutional clients, we take a look at the performance of the Energy sector, recent developments in global trade, and recap today’s US Census release of US factory sales.
See today’s post-market Closer and everything else Bespoke publishes by starting a 14-day free trial to Bespoke Institutional today!