The Closer — Households, Homes, & Wages — 10/31/17
Log-in here if you’re a member with access to the Closer.
Looking for deeper insight on global markets and economics? In tonight’s Closer sent to Bespoke Institutional clients, we review quarterly household formation, homeownership, and rental vacancy stats, August’s Case-Shiller home price indices, and the quarterly employment cost index report from the BLS.

The Closer is one of our most popular reports, and you can sign up for a free trial below to see it!
See today’s post-market Closer and everything else Bespoke publishes by starting a 14-day free trial to Bespoke Institutional today!
B.I.G. Tips – Fed Days November 2017
B.I.G. Tips – October 2017 Performance Drivers (Decile Analysis)
ETF Trends: Fixed Income, Currencies, and Commodities – 10/31/17
Chart of the Day: Meh-lennials
Highest Confidence Since 2000
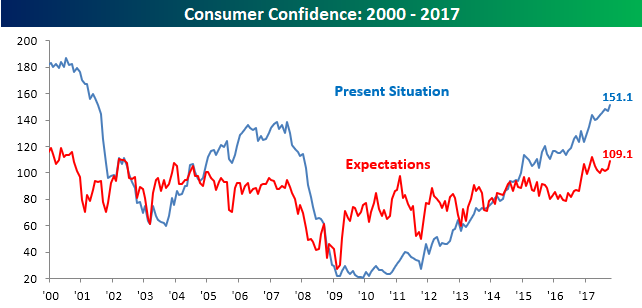
Consumer Confidence for the month of October surged to the highest level since December 2000. While economists were expecting the headline index to show a slight increase to 121.0 from last month’s level of 120.6, the actual reading rose to 125.9, taking out the 124.9 high from March. This month’s print was also the best reading relative to expectations since March.

Consumers aren’t as optimistic about the future as they are about the present, however. When it comes to the present, consumers haven’t been this optimistic since July 2001. When it comes to the future, though, confidence levels still have yet to take out the recent highs from last March. As shown in the chart below, the divergence between sentiment towards the present and future tends to get wider the later you get into the economic cycle, so this kind of trend is closer to late-cycle than early cycle behavior.
Bespoke Stock Scores: 10/31/17
Nikkei: All It Does Is Win
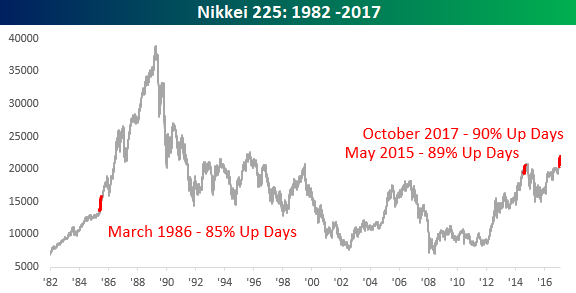
When settling into our desks this morning and checking out how international markets performed overnight, we had to do a double-take when the color next to Japan’s Nikkei 225 was actually red. Sure it was a drop of just 0.0003%, but it was a decline nonetheless. And that’s something we haven’t been accustomed to seeing for Japanese stocks this month. In fact, for the entire month of October, the Nikkei traded down on the day just two times out of 21 trading days! That works out to up days on just over 90% of all trading days and is a level of consistency that has never been seen before.
Since 1970, there have only been three months where the Nikkei traded higher on 85% or more of a month’s trading days, and the other two months were in May 2015 (88.9%) and March 1986 (85%). Each of those three months are highlighted in the chart below, and the performance of the Nikkei following the two prior months is summarized in the table below. The Nikkei’s performance following each of those prior two experiences couldn’t be more different. Back in 1986, the Nikkei was in the middle of an epic bull run that lasted another three years, while the occurrence in May 2015 was followed by a relatively steep decline and then a period of consolidation that continued right up until this month when the Nikkei finally made another multi-year high in mid-October.

The Closer — Equity Strength Readings, Savings Rate Bombs, China Assets — 10/30/17
Log-in here if you’re a member with access to the Closer.
Looking for deeper insight on global markets and economics? In tonight’s Closer sent to Bespoke Institutional clients, we discuss the goings on today in Catalonia, the ECB’s decision to trim stimulus, and the strong footing for the dollar.
The Closer is one of our most popular reports, and you can sign up for a free trial below to see it!
See today’s post-market Closer and everything else Bespoke publishes by starting a 14-day free trial to Bespoke Institutional today!
Politics and Investing: Keep Them Separate
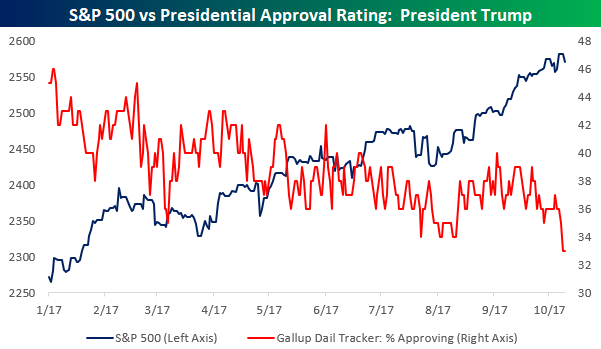
A popular chart making the rounds today is the one below from Gallup, which shows the daily tracking of President Trump’s approval and disapproval ratings. As shown, just ahead of grand jury indictments concerning former members of his campaign staff, the President’s approval rating is sinking like JC Penney, while his disapproval rating looks closer to Apple as it just broke out to new highs.
![]()
While these charts always make for some good conversation, their utility stops right about there, especially when it comes to the market. The chart below compares the performance of the S&P 500 to Trump’s approval rating throughout his Presidency. Even as Trump’s popularity plumbs new lows, the S&P 500 has been going in the exact opposite direction. Sure, the President may be unpopular, and based on his approval ratings there’s only a one in three chance that anyone reading this approves of the job he is doing. Like him or not, though, never let politics impact your investment decisions. Just as a lot of investors missed out on the bulk of this bull market because they didn’t care for President Obama and his policies, another group of different investors has now likely missed out on another good year for the equity market just because they don’t care for President Trump.