Chart of the Day: Caution On Chemicals
the Bespoke 50 — 12/7/17
Every Thursday, Bespoke publishes its “Bespoke 50” list of top growth stocks in the Russell 3,000. Our “Bespoke 50” portfolio is made up of the 50 stocks that fit a proprietary growth screen that we created a number of years ago. Since inception in early 2012, the “Bespoke 50” has beaten the S&P 500 by 63.1 percentage points. Through today, the “Bespoke 50” is up 153.8% since inception versus the S&P 500’s gain of 90.7%. Always remember, though, that past performance is no guarantee of future returns.
To view our “Bespoke 50” list of top growth stocks, click the button below and start a trial to either Bespoke Premium or Bespoke Institutional.

Jobless Claims Fall More Than Expected
Jobless claims saw a slight decline this week, falling from a seasonally adjusted level of 238K down to 236K, but given that consensus forecasts were looking for a slight increase to 240K, it was better than expected. This week’s reading also represents the 144th straight week where jobless claims have been below 300K, which is the longest streak since April 1970 when claims were below 300K for 161 straight weeks. In order to break that record, claims will need to come in below 300k right up through the end of Q1 2018.

With this week’s lower weekly print, the four-week moving average also declined slightly from 242.25K down to 241.5K. That’s just over 10K above the multi-decade low of 231.25K reached back in early November.
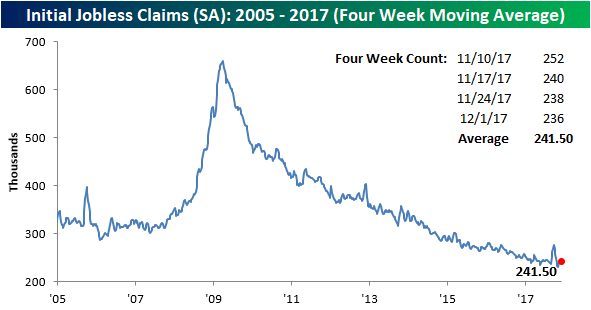
On a non-seasonally adjusted basis (NSA), jobless claims spiked up by more than 100K to 325.8K from 224.9K. That sounds like a big move, but if you look at the chart, big increases are common on a non-seasonally adjusted basis at this time of year. In fact, this week’s print is more than 100K below the post-recession average of 442.3K.

Little Change in Investor Sentiment
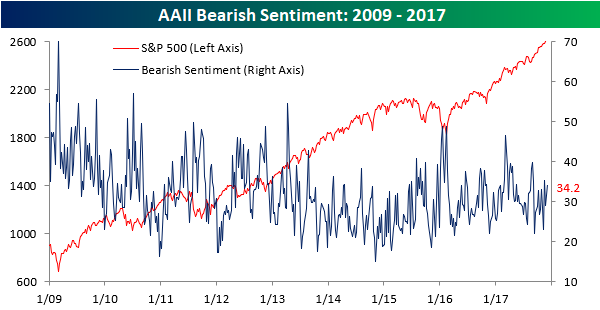
In this week’s AAII sentiment survey, bulls remained out of the majority once again, extending the record to 153 straight weeks. This week’s survey showed little change in optimistic sentiment as bulls remained right near 36%. Given some of the weakness and rotation we have seen in recent days and knowing how fickle this group of investors has been, we would have expected the already weak bullish reading to decline, but it managed to hang in there.

Bearish sentiment, meanwhile, ticked a bit higher this week rising from 31.6% up to 34.2%, which is a three-week high.
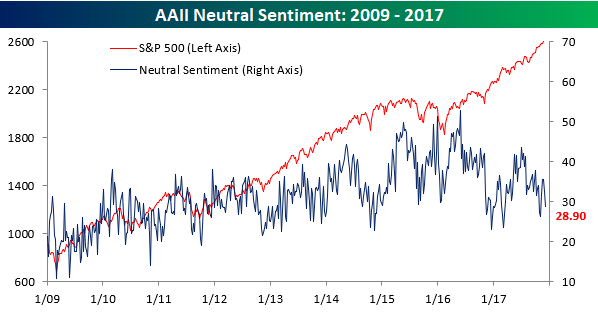
Finally, neutral sentiment fell back below 30%, falling from 32.4% down to 28.9%. That’s the lowest neutral reading since the first week of November. All in all, there was little in the way of sentiment changes this week based on the AAII release.
The Closer — Curve Signals, Energy Data, Productivity Updates — 12/6/17
Log-in here if you’re a member with access to the Closer.
Looking for deeper insight on markets? In tonight’s Closer sent to Bespoke Institutional clients, we examine what kind of yield curve signal is the most dangerous with respect to recession risk. We also review EIA weekly data released today, and the BLS update on productivity for Q3.

See today’s post-market Closer and everything else Bespoke publishes by starting a 14-day free trial to Bespoke Institutional today!
Bespoke Consumer Pulse Report — December 2017
Bespoke’s Consumer Pulse Report is an analysis of a huge consumer survey that we run each month. Our goal with this survey is to track trends across the economic and financial landscape in the US. Using the results from our proprietary monthly survey, we dissect and analyze all of the data and publish the Consumer Pulse Report, which we sell access to on a subscription basis. Sign up for a 30-day free trial to our Bespoke Consumer Pulse subscription service. With a trial, you’ll get coverage of consumer electronics, social media, streaming media, retail, autos, and much more. The report also has numerous proprietary US economic data points that are extremely timely and useful for investors.

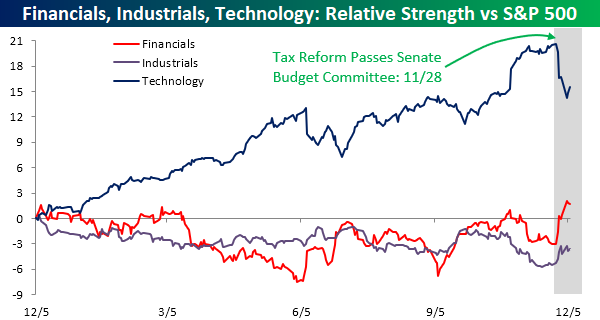
Taxes: Tech Pain is Financials and Industrials Gain
Ever since the GOP tax reform bill moved out of the Senate Budget Committee on the 28th of November, we’ve seen some pretty big rotation out of some sectors and into others. The biggest loser by far, though, has been Technology, while Financials and Industrials have been beneficiaries. The chart below shows the relative strength of all three sectors versus the S&P 500 over the last year where a rising line indicates the sector is outperforming the S&P 500, while a falling line indicates underperformance.
As shown in the chart, Technology had been a huge outperformer on the year leading up to late November, while both Financials and Industrials were lagging the market. That trend came to an abrupt halt last Tuesday, though, when the trends completely reversed. Now before we all start crying over the performance of the Technology sector, we would note that even after the recent moves, it is still outperforming every other sector this year by more than 15 percentage points, so there is a long way to go before it is actually lagging. Furthermore, the stocks that have been hit the hardest are still, for the most part, the biggest winners in 2017. The move in Financials, however, has been impactful as the sector has gone from underperforming the S&P 500 to outperforming on a YTD basis.
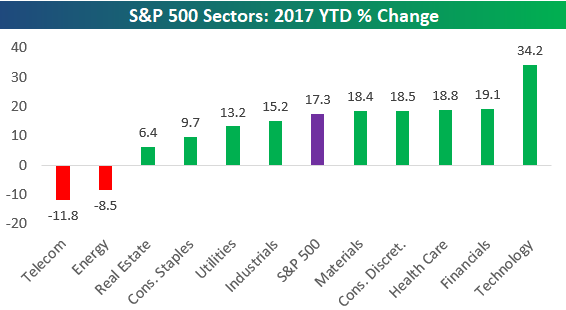
Leaders Become Laggards — Updated YTD Winners
Below is a quick look at S&P 500 sector performance so far in 2017. As shown, even after a pullback over the last week or so, Technology is still up double the S&P 500 with a gain of 34.2%. The next best sector is Financials with a gain of 19.1%, followed by Health Care (18.8%), Consumer Discretionary (18.5%), and Materials (18.4%). Telecom and Energy are both down 8%+ on the year.
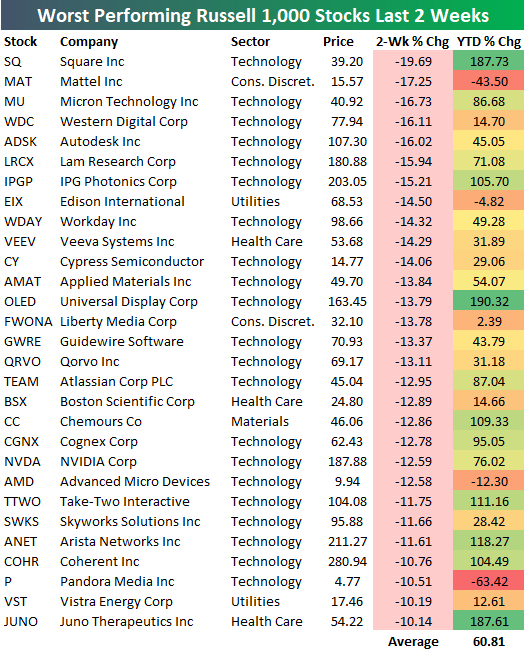
Over the last two weeks, we’ve seen the year’s biggest winners take a beating, while investors have shifted a bit into value stocks that had been underperforming. Below is a list of the biggest losers in the Russell 1,000 over the last two weeks. All of these stocks are down 10%+ over the last 10 trading days, and as you can see, there are quite a few of them!
On average, these stocks are up 60% year-to-date, which shows that investors have been selling the biggest winners.
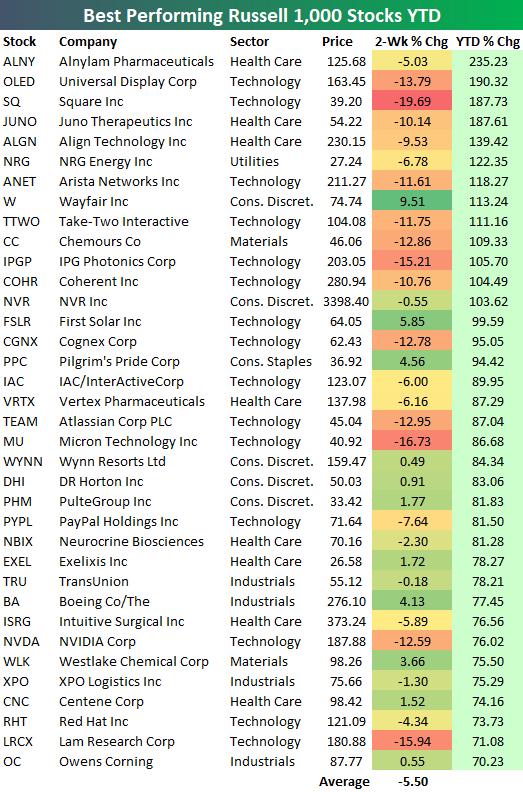
Another way to highlight the recent weakness in the year’s winners is to look at the two-week performance of the stocks that are up the most year-to-date. Below is a list of the top performing stocks in the Russell 1,000 year-to-date. As shown, these stocks are down an average of 5.5% over the last two weeks. Over this same two-week period, the S&P 500 is up 1.18%.
If you’ve had a great year thus far in the stock market, you’ve likely given some back over the last two weeks!
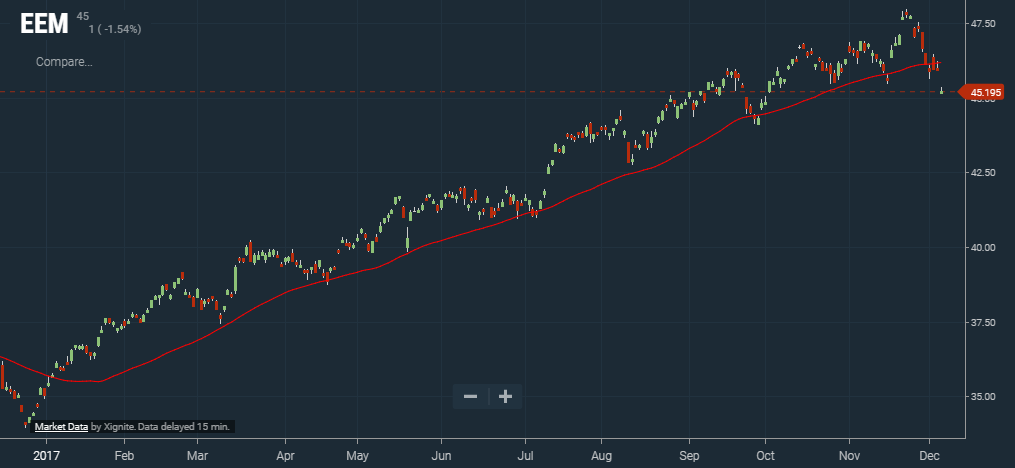
Emerging Markets (EEM) Breakdown
The emerging markets ETF (EEM) had been in a strong uptrend all year, as you can see in the chart below (pulled using our free Chart Tool). It’s about as picture-perfect of an uptrend as you’ll find. Every time the ETF tested support at the bottom of its uptrend channel, it bounced, and every time it tested the top end of the channel, it pulled back. That changed today, however, as the ETF finally broke down below the bottom of its channel. With this support now broken, the year-long uptrend that was in place for EEM is now no more.
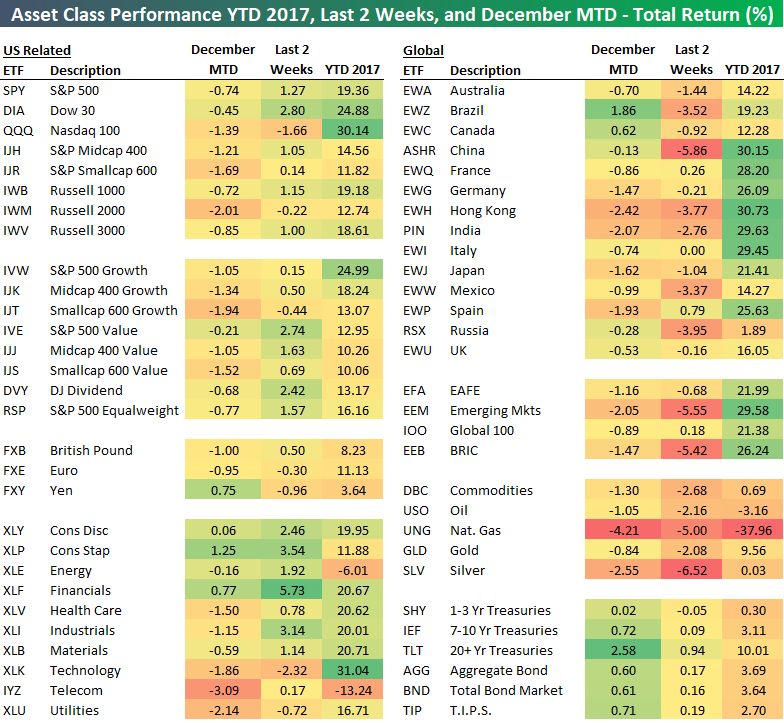
Recent Asset Class Performance Highlights Shift
Below is a look at the recent performance of various asset classes using our ETF total return matrix. For each ETF, we highlight its total return month-to-date, over the last two weeks (since 11/22), and year-to-date.
Starting with the US (left side of matrix), we’ve seen the Nasdaq 100 (QQQ) and smallcaps (IJR, IWM) get hit the hardest so far this month. Value has been significantly outperforming growth as well recently.
Looking at sectors, we’ve seen the two consumer sectors, Energy, and Financials perform best of late, while Technology, Telecom, Industrials, Health Care, and Utilities have been underperforming.
Outside of the US, Brazil (EWZ) and Canada (EWC) are the only two countries that are up so far in December. On the flip side, we’ve seen Hong Kong (EWH), India (PIN), Spain (EWP), Germany (EWG), and Japan (EWJ) all fall more than 1%. Over the last two weeks, China (ASHR) has gotten hit the hardest with a drop of 5.86%.
Emerging markets have been especially weak as well recently. While EEM is up 30% year-to-date, it’s down 5.55% over the last two weeks and over 2% already in December.
As “risk on” asset classes have weakened of late, we’ve seen buyers step into the fixed income ETFs. The 20+ Year Treasury ETF (TLT) is already up 2.58% in December, which leaves it up more than 10% year-to-date.
Click here to learn more about how to use our popular ETF Trends tool.