The Closer: End of Week Charts — 11/3/17
Looking for deeper insight on global markets and economics? In tonight’s Closer sent to Bespoke clients, we recap weekly price action in major asset classes, update economic surprise index data for major economies, chart the weekly Commitment of Traders report from the CFTC, and provide our normal nightly update on ETF performance, volume and price movers, and the Bespoke Market Timing Model. This week, we’ve added a section that helps break down momentum in developed market foreign exchange crosses.

The Closer is one of our most popular reports, and you can sign up for a free trial below to see it!
See tonight’s Closer by starting a two-week free trial to Bespoke Institutional now!
The Bespoke Report — On To November — 11/3/17
ETF Trends: US Sectors & Groups – 11/03/17
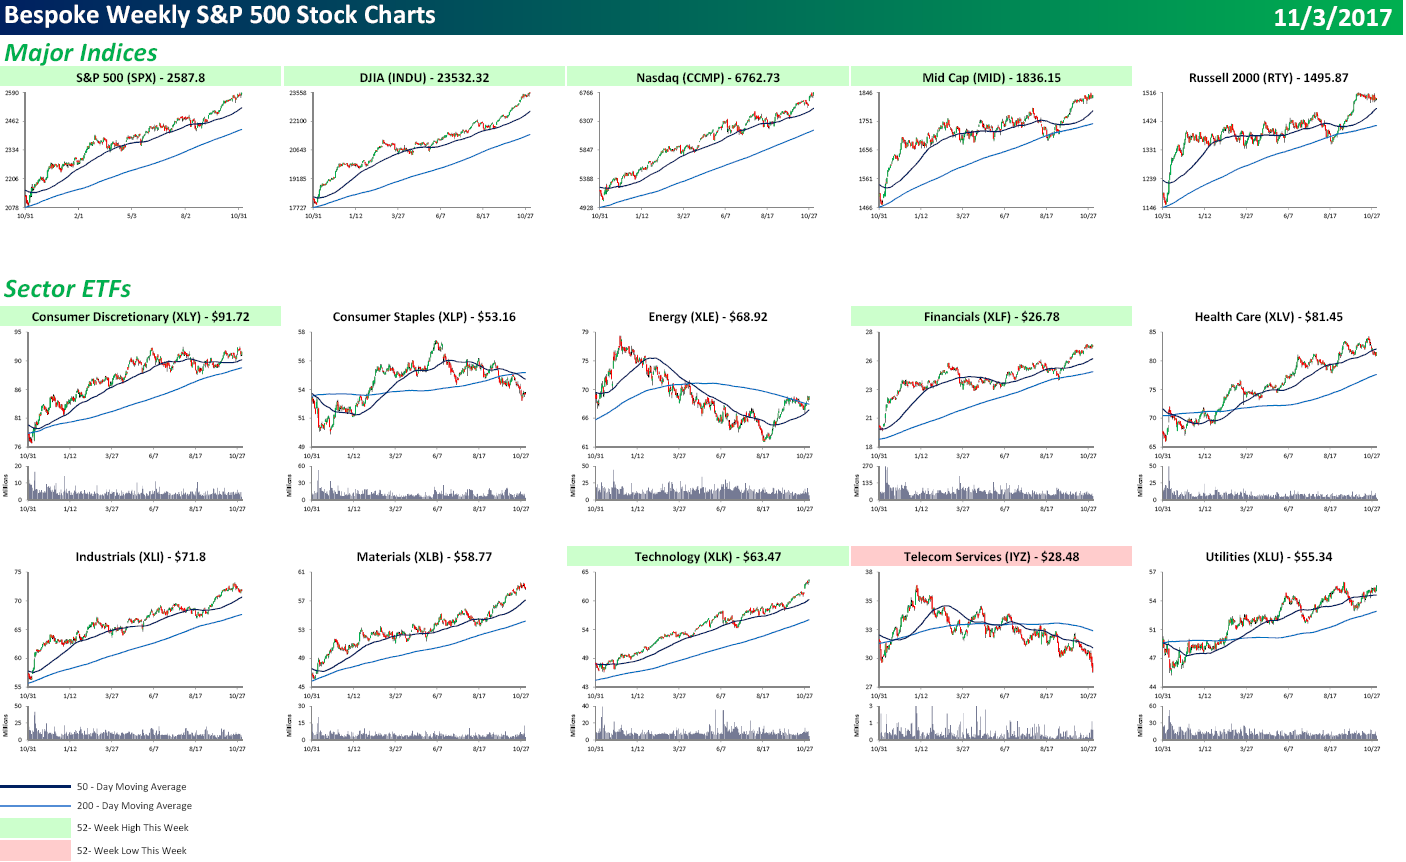
S&P 500 Quick-View Chart Book — 11/3/17
Each weekend as part of our Bespoke Premium and Institutional research service, clients receive our S&P 500 Quick-View Chart Book, which includes one-year price charts of every stock in the S&P 500. You can literally scan through this report in a matter of minutes or hours, but either way, you will come out ahead knowing which stocks, or groups of stocks, are leading and lagging the market. The report is a great resource for both traders and investors alike. Below we show the front page of this week’s report which contains price charts of the major averages and ten major sectors.
As seen in the charts below, the only major average that didn’t hit an all-time high this week was the Russell 2000, but it remains right near its highs with only a small pullback. In terms of individual sectors, we saw new highs from Consumer Discretionary, Financials, and Technology, while Telecom Services (a sector with just three stocks) made a new low.
Make sure to check out our entire S&P 500 Chart Book by signing up for a 14-day free trial to our Bespoke Premium research service.
ETF Trends: Hedge – 11/02/17
The Closer — Stale Breadth — 11/2/17
Log-in here if you’re a member with access to the Closer.
Looking for deeper insight on markets? In tonight’s Closer sent to Bespoke Institutional clients, we take a look at breadth readings for the overall market and individual sectors, including Technology.

The Closer is one of our most popular reports, and you can sign up for a free trial below to see it!
See today’s post-market Closer and everything else Bespoke publishes by starting a 14-day free trial to Bespoke Institutional today!
Bespoke’s Sector Snapshot — 11/2/17
We’ve just released our weekly Sector Snapshot report (see a sample here) for Bespoke Premium and Bespoke Institutional members. Please log-in here to view the report if you’re already a member. If you’re not yet a subscriber and would like to see the report, please start a two-week free trial to Bespoke Premium now.
Below is one of the many charts included in this week’s Sector Snapshot, which is our trading range chart for S&P 500 sectors. The black vertical “N” line represents each sector’s 50-day moving average, and as shown, 7 of 10 sectors are currently above their 50-days. Health Care (XLV) continues to pull back, however, and it broke hard below its 50-day this week. Technology continues to surge, and the sector is now trading well into overbought territory.

To see our full Sector Snapshot with additional commentary plus six pages of charts that include analysis of valuations, breadth, technicals, and relative strength, start a two-week free trial to our Bespoke Premium package now. Here’s a breakdown of the products you’ll receive.
Chart of the Day: Pulse Strength
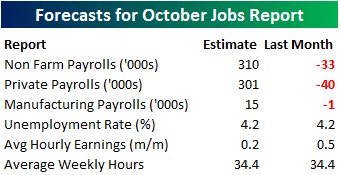
B.I.G. Tips – October Employment Report Preview
Heading into Friday’s Non-Farm Payrolls (NFP) report for October, economists are expecting an increase in payrolls of 310K, which would be a huge improvement from last month’s decline of 33K. If expectations are met, it would be the strongest month for job creation since October 2015 and the biggest month over month increase (+343K) since September 1997! Obviously, a lot of that rebound is related to the bounce-back from the hurricanes, but anytime you are talking about the biggest move in twenty years, it’s impressive. In the private sector, economists are expecting a similar increase to 301K from last month’s level of –40K, but even with the improved job creation numbers, the unemployment rate is expected to remain unchanged at 4.2%. Growth in average hourly earnings is expected to slow back down to 0.2% from last month’s 0.5%, while the average workweek should remain at 34.4 hours per week.
Ahead of the report, we just published our eleven-page monthly preview for the October jobs report. This report contains a ton of analysis related to how the equity market has historically reacted to the monthly jobs report, as well as how secondary employment-related indicators we track looked in October. We also include a breakdown of how the initial reading for October typically comes in relative to expectations and how that ranks versus other months.
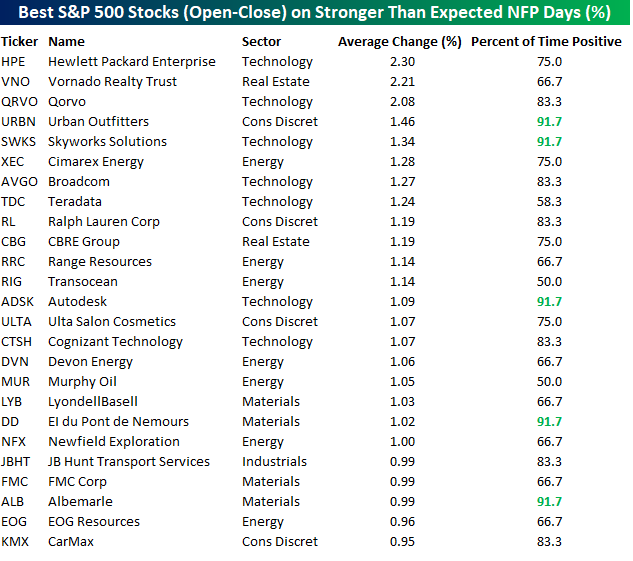
One topic we cover in each month’s report is the S&P 500 stocks that do best and worst from the open to close on the day of the employment report based on whether or not the report comes in stronger or weaker than expected. In other words, which stocks should you buy, and which should you avoid? The table below highlights the best-performing stocks in the S&P 500 from the open to close on days when the Non-Farm Payrolls report has been better than expected over the last two years. Of the 25 top performing stocks on days when the NFP beats expectations, six sectors are represented, with Energy and Technology both leading the way with seven. Leading the way to the upside, Hewlett Packard Enterprises (HPE), Vornado (VNO), and Qorvo (QRVO) have seen average open to close gains of over 2%. In terms of consistency, Urban Outfitters (URBN), Skyworks (SWKS), Autodesk (ADSK), and Albermarle (ALB) have been in the black 92% of the time.
For anyone with more than a passing interest in how equities are impacted by economic data, this report is a must-read. To see the report, sign up for a monthly Bespoke Premium membership now!
Individual Investors Warming Up to Stocks
Stop the presses! Bullish sentiment on the part of individual investors is currently at its highest level since the start of the year. In this week’s sentiment survey from AAII, bullish sentiment increased from 39.6% up to 45.1%. That’s the first 40%+ reading in six weeks and the highest level since the first week of January. Even with the increase, though, bullish sentiment has now still been below 50% for a record 148 straight weeks!
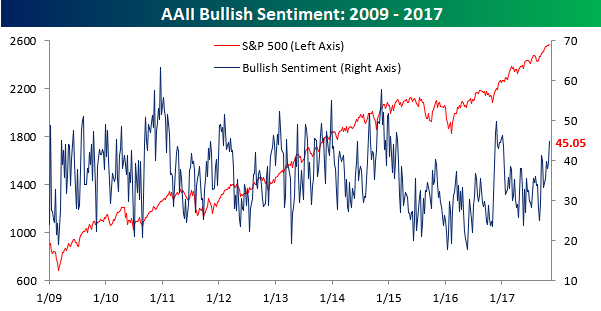
Bearish sentiment dropped nearly 4.5% percentage points to 25.57%. While bullish sentiment has been subdued for some time now, it’s not as if bearish sentiment has been elevated. For example, this week’s print is the sixth time in the last eight weeks that bearish sentiment has been below 30%.
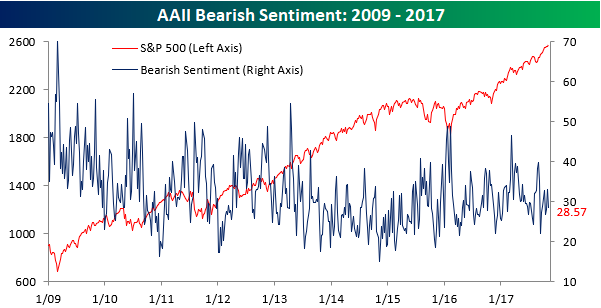
What has been a clear trend for several weeks now is that investors continue to get off the fence. After a recent peak of over 43% at the end of June, neutral sentiment has been steadily trending lower, and at the current level of 26.4% is now at its lowest level since early March.
