Does a Reversion to the Mean Follow Big Up Years?
With just a few hours left in the trading day, the S&P 500 is on track to deliver a hefty gain of over 20% to investors for 2017 and the ninth straight year of gains on a total return basis. In the S&P 500’s history, there has only been one other period where the S&P 500 was in the black for nine straight years, and that was from 1991 to 1999. A big difference between that streak and now, though, is the magnitude of the gains. During the 1990s streak, the S&P 500’s total return was 450% compared to a relatively meager gain of 261% in the current period. If the S&P 500 does make further gains next year, it will be the first ten-year winning streak for the index ever. With such a big gain this year, though, can investors really expect to see gains in the year ahead?
Looking back at the S&P 500’s historical total returns, there have been 32 prior years where the index was up 20% on a total return basis. What’s stunning about this number is the frequency of these types of big years. In fact, there have been 33% more years where the S&P 500 was up 20% or more than years where it was down! The table below lists every year since 1928 where the S&P 500 was up over 20% on a total return basis along with how the index performed in the following year. In the year that followed these ‘big’ years, the index saw an average gain of 10.46% (median: 12.80%) with positive returns just over two-thirds of the time. What’s pretty surprising about these prior returns is that they are only modestly below the average (11.85%) and median (14.30%) total returns of the S&P 500 following years where the index was not up 20% or more. So if it’s a reversion to the mean you are expecting following this year’s big gain, you may be disappointed. In fact, there have been five periods where a 20%+ year was followed by another 20%+ year, and in one of those five periods, the 20%+ year was followed by another four 20%+ years!

Bitcoin’s Big Rallies
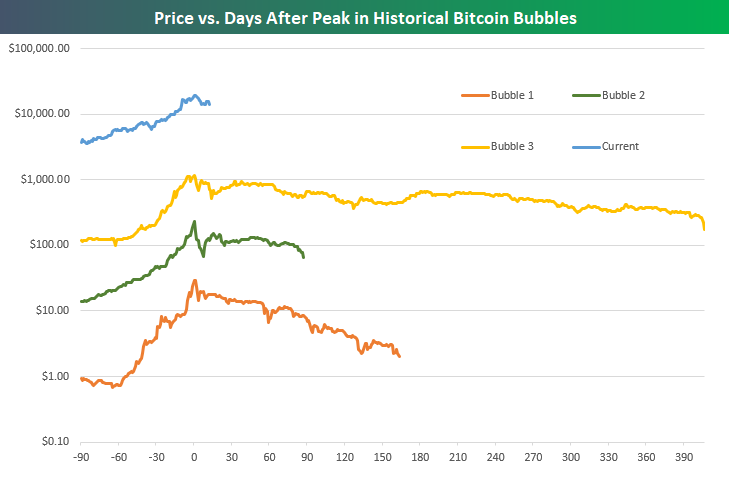
Those who have been around the crypto block know that this isn’t bitcoin’s first rodeo with big price swings. Below is a comparison of past “bubble moves” for Bitcoin’s price. Of course, the volume of bitcoin traded during past bubbles is nowhere near current volume, but the investor psychology remains the same.

Below is a chart of the price movements for the circled bubbles above, labeled in chronological order. On the Y axis is price for a single bitcoin, and the X axis is days before and after the peak of the rally. The chart shows price 90 days prior to the local peak, as well as the price into the next low between peaks. Note that the price is charted using a logarithmic scale, so the distance between one major interval to the next represents a tenfold change in price. While it’s notoriously hard to call a top, especially in the cryptocurrency world, historical comparisons to recent price action look like a bearish signal for the near term.
Bespoke CNBC Appearance (12/28)
Bespoke co-founder Paul Hickey appeared on CNBC’s Power Lunch yesterday (12/28) to discuss markets and the outlook for 2018. The conversation then drifted to the topic of what else? Bitcoin!

The Closer — Modeled ISM, Inventories, & Trade — 12/28/17
Log-in here if you’re a member with access to the Closer.
Looking for deeper insight on markets? In tonight’s Closer sent to Bespoke Institutional clients, we review advance economic indicators from the US Census and what the Chicago PMI suggests about the ISM Manufacturing report due next week.

See today’s post-market Closer and everything else Bespoke publishes by starting a 14-day free trial to Bespoke Institutional today!
Bespoke’s Sector Snapshot — 12/28/17
Chart of the Day: Holiday Season Activity
the Bespoke 50 — 12/28/17
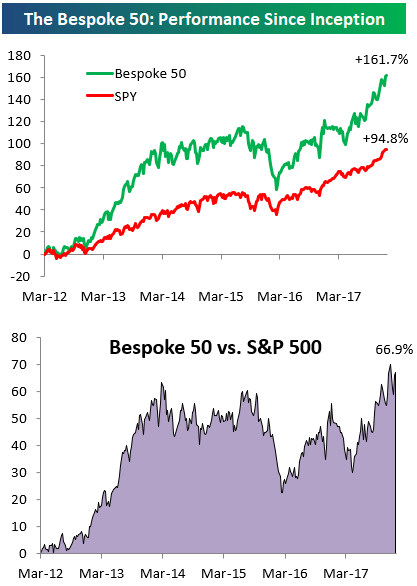
Every Thursday, Bespoke publishes its “Bespoke 50” list of top growth stocks in the Russell 3,000. Our “Bespoke 50” portfolio is made up of the 50 stocks that fit a proprietary growth screen that we created a number of years ago. Since inception in early 2012, the “Bespoke 50” has beaten the S&P 500 by 66.9 percentage points. Through today, the “Bespoke 50” is up 161.7% since inception versus the S&P 500’s gain of 94.8%. Always remember, though, that past performance is no guarantee of future returns.
To view our “Bespoke 50” list of top growth stocks, click the button below and start a trial to either Bespoke Premium or Bespoke Institutional.
Bespoke Bloomberg Appearance (12/28/17)
Bespoke Macro Strategist George Pearkes appeared on Bloomberg’s What Did You Miss on Tuesday evening to discuss where the global economy stands to start 2018. To view the segment, click on the image below.

The Lightning Comes Before the Boom
Bitcoin has seen some impressive growth in the latter half of 2017, but all that growth hasn’t been without growing pains. Due to the nature of blockchain tech, the network that underlies bitcoin will never handle transactions with the rapidity of a centralized authority like Visa. Currently the bitcoin network can only handle about 4 transactions per second at maximum capacity, which is unacceptably slow if it’s ever to be used as a global payment system.
Bitcoin Cash, a fork of bitcoin, attempted to solve this issue by increasing the maximum block size, but doing so is akin to putting out a fire by throwing larger logs on it. The competition to get transactions processed has led to the creation of an artificial “fee market”, where those who can pay higher premiums on their transactions are able to get them processed faster. The average bitcoin transaction fee is now over $40, painfully high for anyone who actually wants to use bitcoin to buy things. For a permanent solution, second layer “off-chain” solutions are required. Enter the Lightning Network.

If the Lightning Network launches successfully, it could transform bitcoin from digital gold into useful currency, enabling cross-border payments to happen in record time. The Lightning Network works by enabling the creation of bi-directional payment “channels” between two parties. The channel functions as an off-chain agreement between the parties on the state of their respective balances. To update the state of the balance, both parties must sign and time-stamp a new transaction. At any time, the state of the channel can be broadcast to the network by either party, which cements the balances permanently in the blockchain.
However, broadcasting to the blockchain only needs to be done in the case of a disagreement, where the blockchain effectively functions as a courtroom. Each party may submit their “evidence” (signed transactions), and the evidence with the most recent timestamp wins. With this setup, a network of channels can be created that allow any two people connected by the network to transact, and only take their transactions to the blockchain in case of a disagreement. For those interested in the nitty-gritty, the lightning network whitepaper can be found here.
Get more crypto/blockchain analysis by following our @bespokecrypto Twitter feed.
Bullish Sentiment: Start of a New Streak?
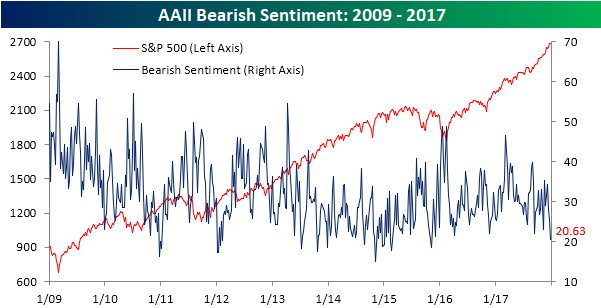
After a record run of weeks where bullish sentiment was below 50%, we have now seen two straight weeks where bullish sentiment has come in above 50%. According to the weekly sentiment survey from AAII, bullish sentiment came in at 52.65% this week, and although it only represented a slight increase from last week, it is the highest weekly reading we have seen since November 2014!

As bullish sentiment has surged, bearish sentiment plummeted to 20.63% from 25.62%, which is the lowest weekly reading since November 2015. The tide in sentiment has really started to turn!