Back to Reality For Individual Investors
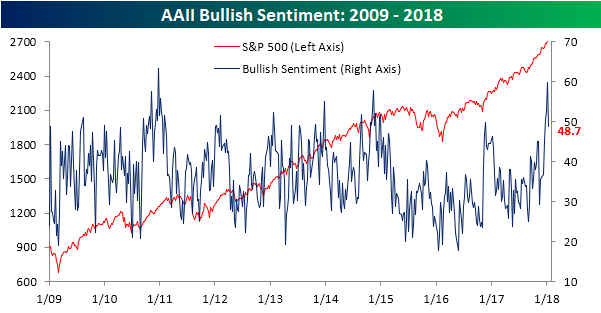
After three straight weeks where bullish sentiment topped 50% in the weekly AAII poll, it was back to reality this week. Bullish sentiment dropped in a big way this week, falling from 59.8% back to below 50% to 48.7%. That was the largest weekly decline since November. It’s hard to imagine what would have caused such a big decline this week, but as we have all seen in the last few years, this is a fickle bunch.
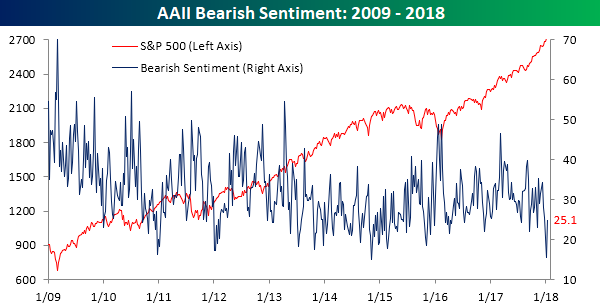
In this week’s survey, the bulls didn’t just move down to the neutral camp either. As shown in the chart below, bearish sentiment saw nearly the same magnitude of a move higher that bullish sentiment saw to the downside.
The Closer — China Can’t Sell, EIA Goes Swell — 1/10/18
Log-in here if you’re a member with access to the Closer.
Looking for deeper insight on markets? In tonight’s Closer sent to Bespoke Institutional clients, we do some mythbusting on China’s ability to influence US yields via reserve changes and discuss another new example of our Trend Analyzer tool.

See today’s post-market Closer and everything else Bespoke publishes by starting a 14-day free trial to Bespoke Institutional today!
Chart of the Day: Does Overbought Equal Overdone?
Fixed Income Weekly – 1/10/18
Searching for ways to better understand the fixed income space or looking for actionable ideals in this asset class? Bespoke’s Fixed Income Weekly provides an update on rates and credit every Wednesday. We start off with a fresh piece of analysis driven by what’s in the headlines or driving the market in a given week. We then provide charts of how US Treasury futures and rates are trading, before moving on to a summary of recent fixed income ETF performance, short-term interest rates including money market funds, and a trade idea. We summarize changes and recent developments for a variety of yield curves (UST, bund, Eurodollar, US breakeven inflation and Bespoke’s Global Yield Curve) before finishing with a review of recent UST yield curve changes, spread changes for major credit products and international bonds, and 1 year return profiles for a cross section of the fixed income world.
In this week’s note, we take a look at the move higher in interest rates, with a focus on the ten and five year notes.

Our Fixed Income Weekly helps investors stay on top of fixed income markets and gain new perspective on the developments in interest rates. You can sign up for a Bespoke research trial below to see this week’s report and everything else Bespoke publishes free for the next two weeks!
Click here and start a 14-day free trial to Bespoke Institutional to see our newest Fixed Income Weekly now!
You Don’t See This Very Often
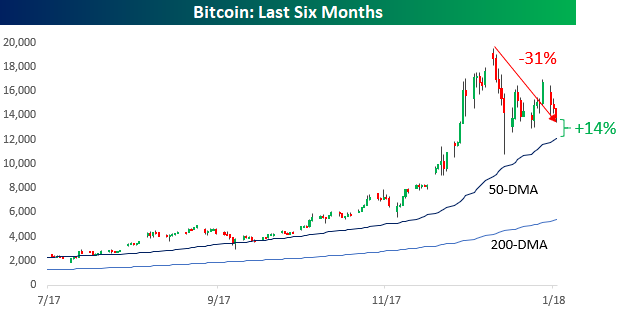
It’s been a rough week for Bitcoin and a lot of other crypto-currencies. Bitcoin is down three days in a row and 17% over this time period. What’s really amazing about the declines in Bitcoin from its high back in mid-December is that even though it’s down over 30%, the price is still 14% above its 50-day moving average. You don’t see that very often, and it just goes to show how insane the rally was from early November through December.
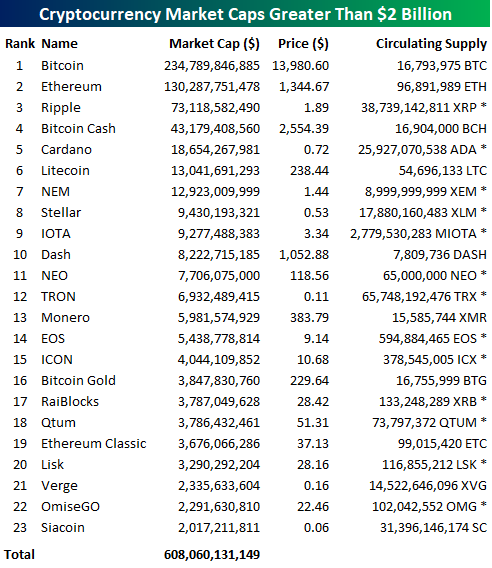
Even after the recent declines in crypto-currencies, there are still 23 cryptos with market values in excess of $2 billion. The table below lists each one of them along with their current value. Not included on this list are another 18 cryptos with market values above $1 billion. That includes Dogecoin, which has a market value of $1.4 bln even though it was created as a joke. The founder has even been quoted as saying, “New features aren’t being implemented into dogecoin because there’s no active development anymore…Eventually, it will become outdated.” Yet people are still paying for it.
As shown at the bottom of the table, the combined market cap of the 23 cryptos listed below is over $600 billion, while the top 100 cryptos have a combined market cap of around $700 billion. In this age where billions are seemingly thrown around like bags of rice, that may not sound like much, but with the total market cap of US equities at around $30 trillion, $700 billion represents nearly 2.5% of all US listed equities. That’s not an insignificant amount for an “asset class” that most people hadn’t even heard about before this past fall.
Bespoke’s Global Macro Dashboard — 1/10/18
Bespoke’s Global Macro Dashboard is a high-level summary of 22 major economies from around the world. For each country, we provide charts of local equity market prices, relative performance versus global equities, price to earnings ratios, dividend yields, economic growth, unemployment, retail sales and industrial production growth, inflation, money supply, spot FX performance versus the dollar, policy rate, and ten year local government bond yield interest rates. The report is intended as a tool for both reference and idea generation. It’s clients’ first stop for basic background info on how a given economy is performing, and what issues are driving the narrative for that economy. The dashboard helps you get up to speed on and keep track of the basics for the most important economies around the world, informing starting points for further research and risk management. It’s published weekly every Wednesday at the Bespoke Institutional membership level.
You can access our Global Macro Dashboard by starting a 14-day free trial to Bespoke Institutional now!

The Closer — JOLTS, Mexican Inflation, Utilities Set-Ups — 1/9/18
Log-in here if you’re a member with access to the Closer.
Looking for deeper insight on markets? In tonight’s Closer sent to Bespoke Institutional clients, we take a look at the JOLTS report, review Mexican inflation, and discuss a new example of our Trend Analyzer tool.
See today’s post-market Closer and everything else Bespoke publishes by starting a 14-day free trial to Bespoke Institutional today!
B.I.G. Tips – Analyst Sentiment Heading into Earnings Season
Earnings season kicks off this week as the first of the major companies start to report Q3 numbers. Most of the big names reporting are all Financials like Blackrock (BLK), JP Morgan (JPM), PNC, and Wells Fargo (WFC) on Friday, but we will also hear results from other notables like Lennar (LEN) and KB Home (KBH) on Wednesday and then Delta (DAL) on Thursday.
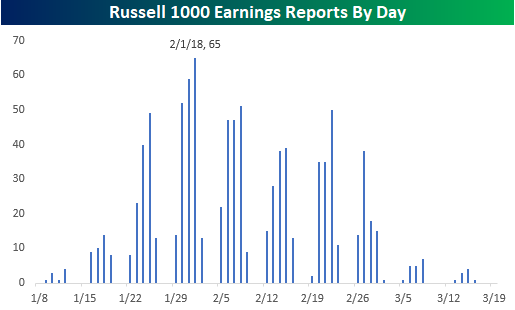
The pace of reports really won’t pick up until the week after next when 133 companies in the Russell 1000 are on the calendar. Then, we get into the peak reporting period in the last week of January/first week of February when 379 companies in the index will report from 1/29 through 2/9. The busiest day in that two-week stretch will be on 2/1 when 65 companies in the Russell 1000 will report. For a more detailed rundown of the earnings schedule for the upcoming season, please see our Interactive Earnings Calendar.
We just published our quarterly look at analyst revisions heading into this earnings season. In this report, we take the current trends and break down how the equity market has performed during prior periods when analyst revisions were at similar levels.
For anyone with more than a passing interest in how equities are impacted by earnings season, this report is a must-read. To see the report, sign up for a Bespoke Premium membership now!
Financial Sector Earnings Reports on Deck
Less than 100 companies will report earnings between now and next Friday, but this week mark’s the official kick-off to the Q4 2017 earnings reporting season. Below is a list of the 30 largest companies set to report between now and January 19th. As you can see, the bulk of large-cap companies set to report over the next 10 days are in the Financial sector.
On Friday alone, we’ll hear from JP Morgan (JPM), Wells Fargo (WFC), BlackRock (BLK), and PNC. How these Financials react to their earnings reports will be an important early signal as to how investors plan to trade earnings this season. As we highlighted yesterday in a Chart of the Day, analysts have gotten extremely bullish ahead of this earnings season, hiking EPS estimates at their fastest pace in ten years. (Bloomberg featured our data in an article on this topic this morning.)
The data included in our table below is pulled from our Interactive Earnings Calendar (which you can use this earnings season by starting a 14-day free trial to Bespoke Premium). For each stock, we show its estimated report date and time, its EPS and revenue estimate, and its historical earnings and revenue beat rate (% of time it has beaten consensus estimates). We also show how the stock has historically traded on its earnings reaction days, which is the first trading day following its past quarterly reports.
As you can see in the table, UnitedHealth (UNH), Goldman Sachs (GS), JP Morgan (JPM), and Synchrony Financial (SYF) are the stocks set to report soon that have historically beaten EPS estimates the most often. In terms of price reactions, Delta Air Lines (DAL), BlackRock (BLK), CSX, Morgan Stanley (MS), KeyCorp (KEY), and Canadian Pacific (CP) have historically gone up the most on their earnings reaction days. Interactive Brokers (IBKR), Bank of America (BAC), and IBM have historically reacted the most negatively to earnings reports.
