Fixed Income Weekly – 1/17/18
Searching for ways to better understand the fixed income space or looking for actionable ideals in this asset class? Bespoke’s Fixed Income Weekly provides an update on rates and credit every Wednesday. We start off with a fresh piece of analysis driven by what’s in the headlines or driving the market in a given week. We then provide charts of how US Treasury futures and rates are trading, before moving on to a summary of recent fixed income ETF performance, short-term interest rates including money market funds, and a trade idea. We summarize changes and recent developments for a variety of yield curves (UST, bund, Eurodollar, US breakeven inflation and Bespoke’s Global Yield Curve) before finishing with a review of recent UST yield curve changes, spread changes for major credit products and international bonds, and 1 year return profiles for a cross section of the fixed income world.
In this week’s note, we review the growing disconnect between global inflation and global yields.

Our Fixed Income Weekly helps investors stay on top of fixed income markets and gain new perspective on the developments in interest rates. You can sign up for a Bespoke research trial below to see this week’s report and everything else Bespoke publishes free for the next two weeks!
Click here and start a 14-day free trial to Bespoke Institutional to see our newest Fixed Income Weekly now!
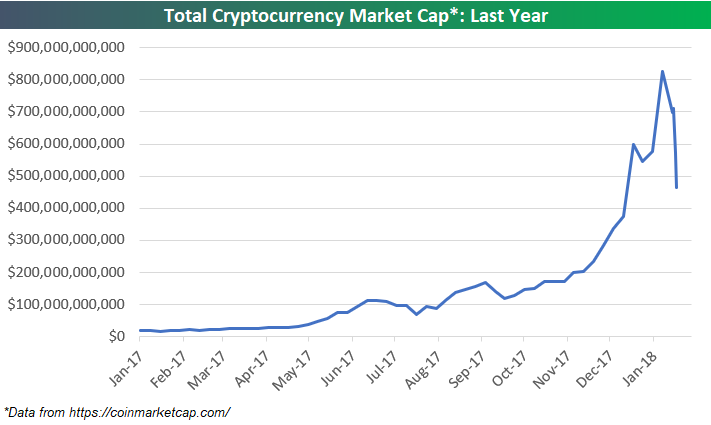
Crypto-Crash — Total Market Cap Down Nearly 50% in a Week
It has been a rough week for cryptocurrencies. Using data from coinmarketcap.com, below is a chart of total crypto market cap over the last year. After eclipsing the $800 billion mark in the first week of 2018, total crypto market cap has fallen 44% to below $500 billion over the last 10 days. Yes — a 44% drop in 10 days! A crash indeed.
Bespoke’s Global Macro Dashboard — 1/17/18
Bespoke’s Global Macro Dashboard is a high-level summary of 22 major economies from around the world. For each country, we provide charts of local equity market prices, relative performance versus global equities, price to earnings ratios, dividend yields, economic growth, unemployment, retail sales and industrial production growth, inflation, money supply, spot FX performance versus the dollar, policy rate, and ten year local government bond yield interest rates. The report is intended as a tool for both reference and idea generation. It’s clients’ first stop for basic background info on how a given economy is performing, and what issues are driving the narrative for that economy. The dashboard helps you get up to speed on and keep track of the basics for the most important economies around the world, informing starting points for further research and risk management. It’s published weekly every Wednesday at the Bespoke Institutional membership level.
You can access our Global Macro Dashboard by starting a 14-day free trial to Bespoke Institutional now!

The Closer — Open And Close Streaks, Inflation Expectations, Buck At New Lows — 1/16/18
Log-in here if you’re a member with access to the Closer.
Looking for deeper insight on markets? In tonight’s Closer sent to Bespoke Institutional clients, we take a look at prior strong open-close runs for the US equity market. We also take a look at New York Fed consumer survey data and the new lows for the USD.

See today’s post-market Closer and everything else Bespoke publishes by starting a 14-day free trial to Bespoke Institutional today!
B.I.G. Tips – S&P 500 Negative Reversals
B.I.G. Tips – Dow Negative Reversals
‘Tis Only A Flesh Wound: BTC On Edge of 40% Drawdown
Bitcoin is known for its volatility, but even by the cryptocurrency’s own high standards, the recent decline of almost 40% off all-time highs is quite large. As shown in the chart below, there have been four other drawdowns which bottomed out at larger declines off ATHs than the current one: the first half of 2011, the first half of 2013, and the 2013-2015 period. At one point near the start of 2012, the cryptocurrency had fallen by 93%! Things may be “different” this time in the sense that the market value of BTC is much higher, there are a broader set of speculators involved, and there are more ways to be exposed to the space including ETPs, futures, and derivatives. All of that said, the drawdown stats on the digital asset are remarkable. On average for the price history we have access to, BTC has been in a 25% drawdown. It’s been in a drawdown of 25% or more 71% of the time! Furthermore, it has closed at a record level on only 173 days (8.9% of all days in our price history). While BTC is up 14237510% since July of 2010, all of those gains have come on less than 180 discrete trading days. Pretty remarkable!
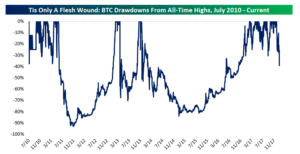
The chart is also a good cautionary note for any investor looking to get involved in cryptocurrencies. Regardless of your long-term view, price action can and will move against you quite aggressively for long periods of time. Make sure to keep this in mind when considering anything related to the space as an investment.
S&P 500 Stock Seasonality – 1/16/18
While we don’t ever suggest that investors should base their trading solely on the calendar, there is evidence that the market and many stocks do indeed follow seasonal patterns. This makes our S&P 500 Stock Seasonality report a useful addition to every investor’s toolbox. Using the last ten years worth of price data, our Stock Seasonality report looks at the average returns for the S&P 500, its eleven sectors, and its 500 individual stocks. In the report, we highlight the five stocks in each sector that have historically been the best and worst performers over the next two weeks. For each stock, we also include information such as average returns, the percent of time each stock or sector is positive/outperforms the S&P 500, and its historical performance over the next two weeks for each of the last ten years. The Stock Seasonality report is published on a weekly basis on Mondays, and it is available to all Bespoke Premium and Bespoke Institutional subscribers.
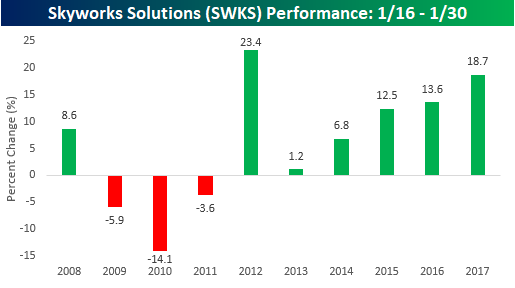
One stock that we wanted to highlight this week is Skyworks Solutions (SWKS). With a median gain of 7.7%, SWKS has been the second-best performing stock in the S&P 500 from the close on 1/16 through the close on 1/30 over the last ten years. It has also been positive during this period for six straight years, including three straight years where it has rallied over 10%. Can you guess what the best performing stock in the S&P 500 has been?
For active traders, our Stock Seasonality report is an excellent tool to help keep track of the best and worst times of year for the overall market, sectors, and individual stocks. To see the report, sign up for a monthly Bespoke Premium membership now!