B.I.G. Tips – Retail Sales Surge
Chart of the Day: Cyclical Indicators Soar
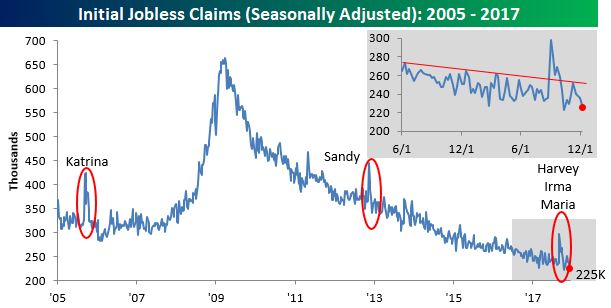
Jobless Claims Back Near Cycle Lows
While they haven’t seen much of an increase in the first place, initial jobless claims fell by 11K this week, dropping down to 225K compared to the consensus forecast of 236K. At current levels, weekly claims are just 2K higher than the cycle low of 223K that we saw on 10/13/17. That now makes it 145 straight weeks (or nearly three years) since claims were last above 300K. We’re simply out of adjectives to describe how amazing of a streak this is given the size of the US labor force.
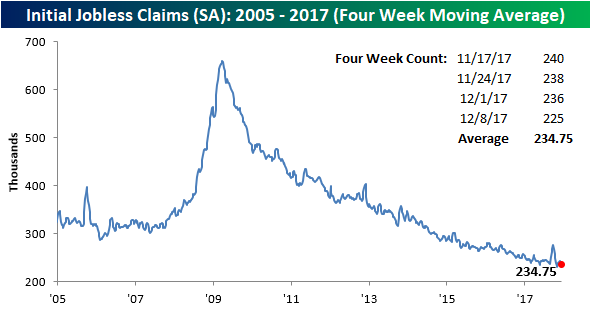
With this week’s drop in weekly claims, we also saw a nice decline in the four-week moving average which fell from 241.5K down to 234.75K. That’s just 3.5K above the cycle low of 231.25K that we saw back in the first week of November, so we could see a new low in this indicator next week if claims stay around current levels.
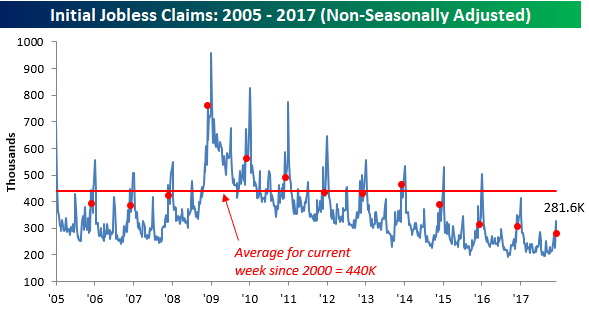
On a non-seasonally adjusted basis (NSA), jobless claims fell by 44.5K down to 281.6K. For the current week of the year that’s more than 150K below the average of 440K since 2000 and the lowest reading for the current week of the year since 1969!
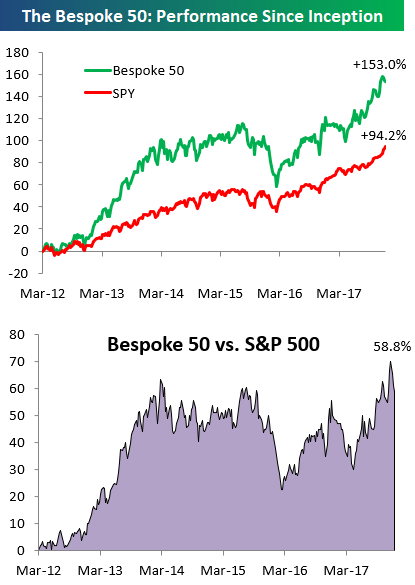
the Bespoke 50 — 12/14/17
Every Thursday, Bespoke publishes its “Bespoke 50” list of top growth stocks in the Russell 3,000. Our “Bespoke 50” portfolio is made up of the 50 stocks that fit a proprietary growth screen that we created a number of years ago. Since inception in early 2012, the “Bespoke 50” has beaten the S&P 500 by 58.8 percentage points. Through today, the “Bespoke 50” is up 153.0% since inception versus the S&P 500’s gain of 94.2%. Always remember, though, that past performance is no guarantee of future returns.
To view our “Bespoke 50” list of top growth stocks, click the button below and start a trial to either Bespoke Premium or Bespoke Institutional.
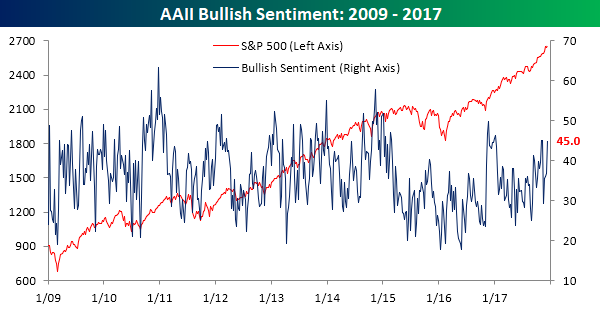
Bullish Sentiment Rises For Fourth Straight Week
With markets heading into the home-stretch in what is usually a positive time of year for stocks, individual investors are feeling increasingly confident towards the market. According to this week’s sentiment poll from the American Association of Individual Investors (AAII), bullish sentiment increased from 36.9% up to 45%. That’s the greatest weekly increase in three months and the fourth straight week of increased optimism. The last time bullish sentiment increased for four straight weeks was back in early 2016, and we haven’t seen five straight weeks of increased bullish sentiment since 2012! Given the increases in sentiment, it’s hard to believe that bulls haven’t been able to take a majority, but at least sentiment is back above average. It has now been a record 154 straight weeks since bullish sentiment last eclipsed 50%.
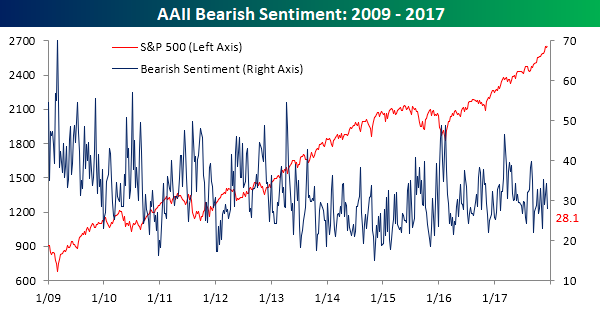
Bearish sentiment saw a 6.1 percentage point decline this week falling from 34.2% down to 28.1%. That’s the lowest weekly print for bearish sentiment in just over a month, but nowhere near the lowest levels of the year.
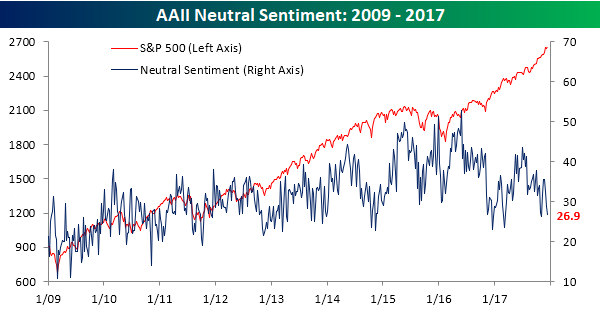
Finally, fewer and fewer investors are sitting on the fence these days as neutral sentiment dropped to 28.1% from 34.2% last week. That’s the lowest reading in that measure since 11/2.
The Closer — Fed & Inflation — 12/13/17
Log-in here if you’re a member with access to the Closer.
Looking for deeper insight on markets? In tonight’s Closer sent to Bespoke Institutional clients, we assess the FOMC policy decision today. We also discuss the weak CPI print this morning.

See today’s post-market Closer and everything else Bespoke publishes by starting a 14-day free trial to Bespoke Institutional today!
Chart of the Day: After Rate Hikes
Fixed Income Weekly – 12/13/17
Searching for ways to better understand the fixed income space or looking for actionable ideals in this asset class? Bespoke’s Fixed Income Weekly provides an update on rates and credit every Wednesday. We start off with a fresh piece of analysis driven by what’s in the headlines or driving the market in a given week. We then provide charts of how US Treasury futures and rates are trading, before moving on to a summary of recent fixed income ETF performance, short-term interest rates including money market funds, and a trade idea. We summarize changes and recent developments for a variety of yield curves (UST, bund, Eurodollar, US breakeven inflation and Bespoke’s Global Yield Curve) before finishing with a review of recent UST yield curve changes, spread changes for major credit products and international bonds, and 1 year return profiles for a cross section of the fixed income world.
In this week’s note, we take a look at the steady increase in interest rates brought about by Fed monetary tightening.

Our Fixed Income Weekly helps investors stay on top of fixed income markets and gain new perspective on the developments in interest rates. You can sign up for a Bespoke research trial below to see this week’s report and everything else Bespoke publishes free for the next two weeks!
Click here and start a 14-day free trial to Bespoke Institutional to see our newest Fixed Income Weekly now!
Gas Prices Having a ‘Normal’ Year
It has been anything but a normal year for energy prices (and gas prices in particular) this year as the typical seasonal trends have been absent from the market. The chart below compares a composite annual YTD percentage change of average gasoline prices going back to 2005 to the performance of prices this year. While prices usually rise in the first half of the year, they were essentially flat in the first half of this year. Then, towards the end of the Summer, when prices usually start to fall, this year they saw a boost from the hurricanes that ravaged Texas, Florida, Puerto Rico, and the Virgin Islands. Beginning in mid-September, though, seasonal trends finally started to take hold, and beginning in November, gasoline prices finally started to perform in line with their seasonal pattern and have been tracking it ever since.
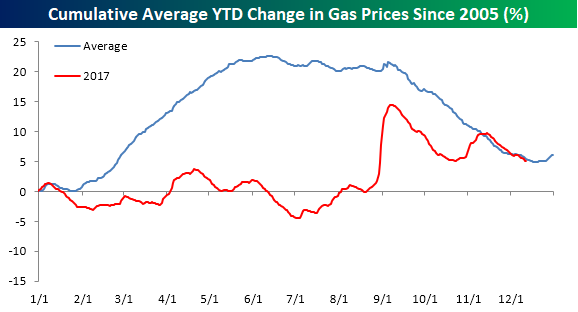
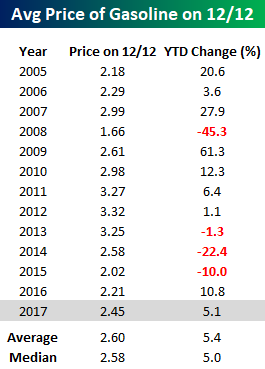
The table below compares the national average price of a gallon of gas to the national average at this point in prior years dating back to 2005. At a current national average price of $2.45, prices are up 5.1% YTD, which is right between the average and median YTD change going back to 2005. So while the road getting here was far from typical, 2017 is ending up as a pretty normal year for consumers at the pump.
Bespoke’s Global Macro Dashboard — 12/13/17
Bespoke’s Global Macro Dashboard is a high-level summary of 22 major economies from around the world. For each country, we provide charts of local equity market prices, relative performance versus global equities, price to earnings ratios, dividend yields, economic growth, unemployment, retail sales and industrial production growth, inflation, money supply, spot FX performance versus the dollar, policy rate, and ten year local government bond yield interest rates. The report is intended as a tool for both reference and idea generation. It’s clients’ first stop for basic background info on how a given economy is performing, and what issues are driving the narrative for that economy. The dashboard helps you get up to speed on and keep track of the basics for the most important economies around the world, informing starting points for further research and risk management. It’s published weekly every Wednesday at the Bespoke Institutional membership level.
You can access our Global Macro Dashboard by starting a 14-day free trial to Bespoke Institutional now!
