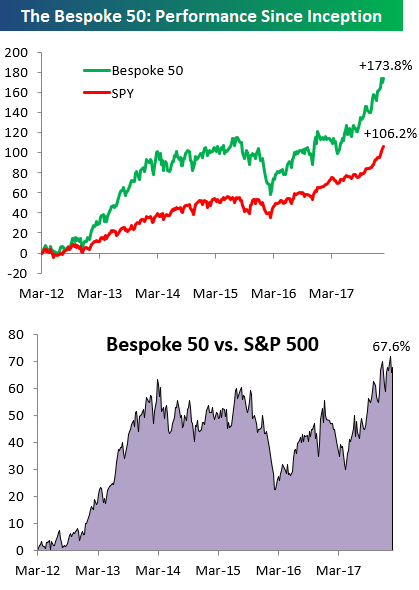
the Bespoke 50 — 1/25/18
Every Thursday, Bespoke publishes its “Bespoke 50” list of top growth stocks in the Russell 3,000. Our “Bespoke 50” portfolio is made up of the 50 stocks that fit a proprietary growth screen that we created a number of years ago. Since inception in early 2012, the “Bespoke 50” has beaten the S&P 500 by 67.6 percentage points. Through today, the “Bespoke 50” is up 173.8% since inception versus the S&P 500’s gain of 106.2%. Always remember, though, that past performance is no guarantee of future returns.
To view our “Bespoke 50” list of top growth stocks, click the button below and start a trial to either Bespoke Premium or Bespoke Institutional.
Bullish Sentiment Drops to a Six-Week Low
After a spike in positive sentiment among individual investors around the New Year, enthusiasm has been a bit more tempered in the last three weeks, falling by over 14 percentage points from its recent high on 1/4. According to the weekly sentiment survey from AAII, bullish sentiment dropped from 54.1% last week to 45.45% this week. That’s the lowest level of bullish sentiment since mid-December but is still well above the bull market average of just under 37%.
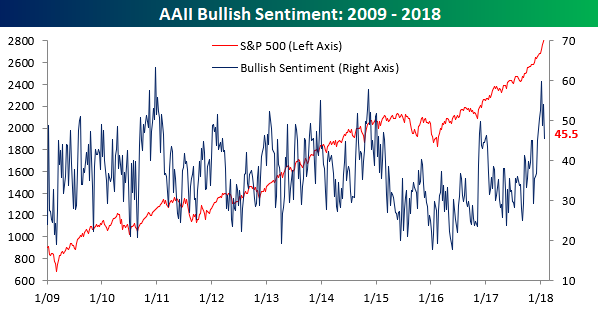
Although bullish sentiment has seen a pretty notable decline, the corresponding increase in bearish sentiment has not been as sharp. In this week’s survey, bearish sentiment increased from 21.4% up to 24.03%, which is up less than nine percentage points from its recent lows.

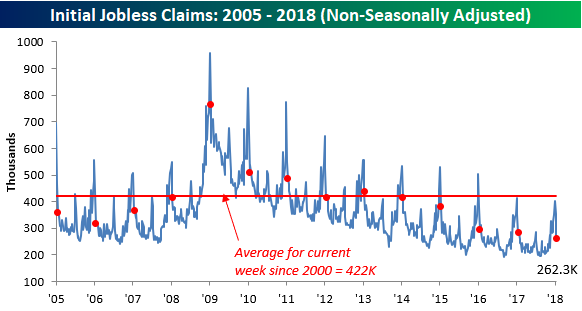
Jobless Claims Rise Slightly Less Than Expected
Initial jobless claims saw their largest weekly increase since mid-December this week, rising from 216K up to 233K. While the 17K increase may be relatively large, you have to keep in mind that last week’s reading was not only the lowest weekly print since the 1970s, but it was also revised lower from an originally reported 220K. At some point, claims just can’t drop any lower. With this week’s reading, claims have now been below 300K for 151 straight weeks!

Even as claims increased this week, the four-week moving average dropped by 3.5K down to 240K and barring big increases in weekly claims over the next two weeks, this reading should continue to drop as the next two weekly prints that will be falling off the count are 250K and 261K. As it stands now, the current four-week average is 8.75K above the prior cycle low of 231.25K, but that level may actually come into play in the coming weeks.
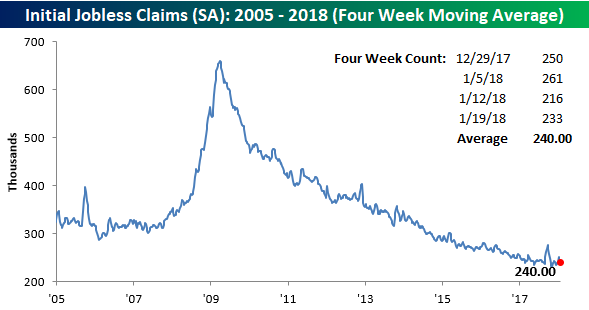
On a non-seasonally adjusted (NSA) basis, this week’s report was the most impressive, though, as claims fell from 354.1K down to 262.3K. That’s more than 159K below the average for the current week of the year since 2000, and to find a year where claims were lower at this time of year than they are now, you have to go all the way back to…forever! Well, that’s not entirely accurate, but since the data for US jobless claims begins, NSA claims have never been lower for the current week of the year than they are now!
The Closer — Need More Homes As Oil Drains Away — 1/24/18
Log-in here if you’re a member with access to the Closer.
Looking for deeper insight on markets? In tonight’s Closer sent to Bespoke Institutional clients, we review the state of play in energy market data following EIA inventory data today. We also discuss extremely low existing home inventories.

See today’s post-market Closer and everything else Bespoke publishes by starting a 14-day free trial to Bespoke Institutional today!
B.I.G. Tips – Caterpillar Sales Growth Hits a Seven-Year High
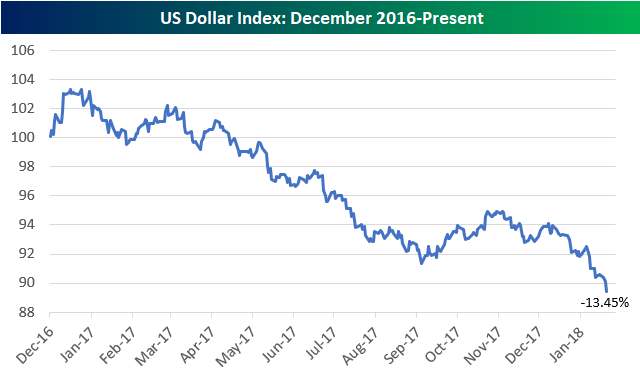
Dollar’s Drop Has Big Impact on Stocks
When the dollar is falling, US companies that generate most or all of their revenues outside of the US end up benefiting. And ultimately that benefit works its way into share price performance. Recent price action proves it.
As shown below, the US Dollar index is down 13.45% since its high from December 2016.
Using our International Revenues Database (available to Premium and Institutional members), we broke the Russell 1,000 into two groups. One group contains stocks that generate more than 50% of their revenues outside of the US. The other group contains stocks that generate less than 10% of their revenues outside of the US (or >90% of their revenues domestically).
We calculated the average performance of stocks in each basket over two time periods — since 12/28/16 when the dollar peaked, and since the start of 2018.
Given the dollar’s steep drop, you would expect to see the “international” basket do much better than the “domestic” basket, and that is exactly how things have played out. As shown, the stocks that generate >50% of their revenues outside of the US are up 35.35% since the dollar peaked, and they’re up 7.3% year-to-date. The stocks that generate less than 10% of their revenues outside of the US are up just 16.23% since the dollar peaked on 12/28/16, while they’re up just 3.62% year-to-date. Over both time periods, the basket of “international” stocks has doubled the basket of “domestic” stocks.
Expect this trend to continue as long as the dollar is falling. If the dollar puts in a bottom, though, you should see pretty dramatic rotation back into the “domestic” stocks.
Start a 14-day free trial to Bespoke Institutional to use our International Revenues Database now.

Fixed Income Weekly – 1/24/18
Searching for ways to better understand the fixed income space or looking for actionable ideals in this asset class? Bespoke’s Fixed Income Weekly provides an update on rates and credit every Wednesday. We start off with a fresh piece of analysis driven by what’s in the headlines or driving the market in a given week. We then provide charts of how US Treasury futures and rates are trading, before moving on to a summary of recent fixed income ETF performance, short-term interest rates including money market funds, and a trade idea. We summarize changes and recent developments for a variety of yield curves (UST, bund, Eurodollar, US breakeven inflation and Bespoke’s Global Yield Curve) before finishing with a review of recent UST yield curve changes, spread changes for major credit products and international bonds, and 1 year return profiles for a cross section of the fixed income world.
In this week’s note, we take a look at the acceleration in yields towards multi-decade trend breaks.

Our Fixed Income Weekly helps investors stay on top of fixed income markets and gain new perspective on the developments in interest rates. You can sign up for a Bespoke research trial below to see this week’s report and everything else Bespoke publishes free for the next two weeks!
Click here and start a 14-day free trial to Bespoke Institutional to see our newest Fixed Income Weekly now!
Bespoke’s Global Macro Dashboard — 1/24/18
Bespoke’s Global Macro Dashboard is a high-level summary of 22 major economies from around the world. For each country, we provide charts of local equity market prices, relative performance versus global equities, price to earnings ratios, dividend yields, economic growth, unemployment, retail sales and industrial production growth, inflation, money supply, spot FX performance versus the dollar, policy rate, and ten year local government bond yield interest rates. The report is intended as a tool for both reference and idea generation. It’s clients’ first stop for basic background info on how a given economy is performing, and what issues are driving the narrative for that economy. The dashboard helps you get up to speed on and keep track of the basics for the most important economies around the world, informing starting points for further research and risk management. It’s published weekly every Wednesday at the Bespoke Institutional membership level.
You can access our Global Macro Dashboard by starting a 14-day free trial to Bespoke Institutional now!

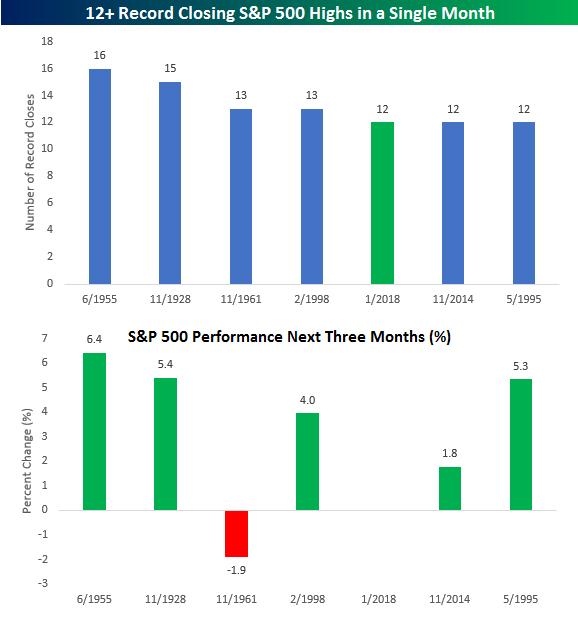
12 Record Closing Highs and Counting
So far in 2018, every trading day where the S&P 500 has finished the day higher has been a record all-time closing high. Just to show how little downside pressure there has been, in the three days where the S&P 500 did trade lower this year, the cumulative decline was just 17 points! That’s five fewer points than this past Monday’s 22-point gain alone. In total, there have now been twelve record closing highs in 2018, which is already tied for the fourth most in a single month in the index’s history. The record for a single month is 16 back in June 1955, and with just six trading days left this month, the odds are slim that we tie, let alone beat the record.
In the lower chart, we have shown the S&P 500’s performance in the three months that followed each of the prior months where the S&P 500 saw 12 or more record highs in a single month. Of the six prior months shown, the market went on to post further gains five times. The only down period was a 1.9% decline in November 1961, while the five periods where the S&P 500 was positive, the index put up gains ranging from 1.8% to 6.4%.