Bespokecast Episode 21 — Jill Carlson & Dan Ciotoli — Now Available on iTunes, GooglePlay, Stitcher and More
 Our newest episode of Bespokecast is now available! Be sure to subscribe to Bespokecast on your preferred podcast app to gain access to our full collection of episodes. We’d also love for you to provide a review as well!
In this episode of Bespokecast, we have two guests. Jill Carlson (@_jillruth and jill-carlson.com) is an independent blockchain analyst and developer, with experience trading, academically researching, and building crypo products. She’s a former bond trader with a nuanced and practical view of the space but an optimistic outlook for the implications and possible deployments of blockchain tech. Dan Ciotoli is Bespoke’s crypto analyst. You can see his work on @bespokecrpyto. Dan has an undergraduate degree in computer science and is hugely enthusiastic about the crypto space, while retaining a healthy dose of skepticism about the current market. We managed to make it most of the way through our discussion without discussing price action; instead, we focused on the underlying technology and philosophy of crypto products and the blockchain, discussing both what it does well and misapplications. If you’re not at least generally familiar with what blockchain and crypto are, we strongly recommend our Bespoke Brief on the subject, which you can read here.
To listen to our newest episode or subscribe to the podcast via iTunes, GooglePlay, OvercastFM, or Stitcher, please click the button or links below. Please note that third-party podcast feeds may update at a lag of a few hours to this blog post.

Bespoke Brunch Reads: 1/28/18
Welcome to Bespoke Brunch Reads — a linkfest of the favorite things we read over the past week. The links are mostly market related, but there are some other interesting subjects covered as well. We hope you enjoy the food for thought as a supplement to the research we provide you during the week.
Headline Oddities (Europe Edition)
German far-right AfD politician resigns after converting to Islam by Nik Martin (DW)
Germany’s extremist official opposition party (assuming Grand Coalition negotiations go as planned) is virulently anti-Islam, but one of its members clearly saw something he liked. [Link]
Nutella ‘riots’ spread across French supermarkets (BBC)
Apparently American Black Friday shoppers aren’t the only ones that are willing to go to extremes in order to get a good deal on a precious commodity. [Link]
Childhood Tragedy
Measles cases rise six-fold in Italy as populists pledge to scrap compulsory vaccines (The Local)
After populist the Five Star Movement (likely to win a plurality in upcoming March elections but not likely to form a government) and center-right Northern League (likely to help form a government) political parties took anti-vaccine stances in response to discredited research claiming (incorrectly) links between vaccines and autism, vaccination rates in Italy fell and long-dead diseases have started to make a comeback. [Link]
Parental Imprisonment and Premature Mortality in Adulthood by Steve G. A. van de Weijer, Holly S. Smallbone, and Valery Bouwman (Journal of Development and Life-Course Criminology)
Research from the Netherlands showing a link between the imprisonment of parents and mortality rates of their children. [Link]
Geopolitics
China’s Rise Is Over by Daniel C. Lynch (Stanford University Press)
While there has been a long-held belief in Western circles that China is ascendant, Lynch argues that the more conservative outlook of Chinese policymakers is closer to reality. [Link]
Crypto
Let Me Tell You Some More About Bitcoin—Hello? Hello? by Kirsten Grind (WSJ)
A catalogue of the human tool bitcoin enthusiasm is taking on the relationships of some of its most ardent enthusiasts. [Link; paywall]
The Programmer at the Center of a $100 Billion Crypto Storm by Paul Vigna and Jim Oberman (WSJ)
One of the most-trafficked websites in the world uses algorithms and price feeds from global exchanges to give real-time market caps for the crypto space. It’s run out of an apartment in Brooklyn. [Link; paywall]
Maps
The Atlas Of Redistricting by Aaron Bycoffe, Ella Koeze, David Wasserman and Julia Wolfe (538)
A really interesting project that allows you to see maps of the country or a given state under current laws and with a variety of hypothetical redistricting priorities. [Link]
Think your country is crowded? These maps reveal the truth about population density across Europe by Alasdair Roe (The Conversation)
Where do people in Europe actually live? The answer isn’t as simple as a population density calculation, with huge variation of densities within countries or regions. [Link]
Anthropology
The Troubling Origins of the Skeletons In A New York Museum by Daniel A. Gross (NYer)
Museums around the world house human remains, and in some cases their origins or provenance is either disturbing or downright inhumane. [Link]
Happy Birthday!
World’s largest ETF roars past $300bn in assets by John Authers, Joe Rennison, and Robin Wigglesworth (FT)
This year the S&P 500 ETF SPY hit its 25th birthday, buoyed by billions of inflows for index-linked passive products more generally. [Link; paywall]
Health Care
2016 Health Care Cost and Utilization Report (Health Care Cost Institute)
Despite falling utilization of health care services (including a drop of 12.9% for inpatient services from 2012 to 2016), surging prices have driven strong spending gains (in the case of inpatient services, prices are up 24.3% giving an 8.3% total spending growth over those years). A succinct summary of how broken the health care system is for most people. [Link]
Apple, in Sign of Health Ambitions, Adds Medical Records Feature for iPhone by Natasha Singer (NYT)
More evidence that Apple has its eyes on the health care market: the company has introduced a feature that would allow users to import health records to their phones. [Link]
Corruption
“Get Out of Jail Free” Cards by Alex Tabarrok (Marginal Revolution)
A rundown of the recent NYC police officer’s union decision to reduce the number of “get out of jail free” cards given to officers for distribution to family, including some scathing rebukes of the corrupt practice. [Link]
Taxes
The Tax Break That Doctors and Plumbers Both Will Miss by Ruth Simon (WSJ)
Trying to figure out what types of business qualify for the new pass-through provisions of the recent tax changes passed at the end of 2017 is an incredibly difficult process, making our complicated tax code that much more byzantine. [Link; paywall]
PR Nightmares
Walnut Hills grad’s post mocking Fox News viewers causes controversy for SCOTTeVEST by Scott Wartman (Cincinnati Enquirer)
In a Facebook post about his business, a vest company CEO made comments about customers he reaches via Fox News that don’t read very well, putting it mildly. [Link]
Have a great Sunday!
The Bespoke Report — The Energizer Market — 1/26/18
S&P 500 Quick-View Chart Book: 1/26/18
Each weekend as part of our Bespoke Premium and Institutional research service, clients receive our S&P 500 Quick-View Chart Book, which includes one-year price charts of every stock in the S&P 500. You can literally scan through this report in a matter of minutes or hours, but either way, you will come out ahead knowing which stocks, or groups of stocks, are leading and lagging the market. The report is a great resource for both traders and investors alike. Below we show the front page of this week’s report which contains price charts of the major averages and ten major sectors.
In our Chart Book, a green headline means the chart hit a new 52-week high this week. As you can see below, just about everything on an index and sector level was green this week. The only sectors that didn’t hit a 52-week high at some point in the week were Telecom Services and Utilities. Remarkable.
You can view our entire S&P 500 Chart Book by signing up for a 14-day free trial to our Bespoke Premium research service.

The Closer: End of Week Charts — 1/26/18
Looking for deeper insight on global markets and economics? In tonight’s Closer sent to Bespoke clients, we recap weekly price action in major asset classes, update economic surprise index data for major economies, chart the weekly Commitment of Traders report from the CFTC, and provide our normal nightly update on ETF performance, volume and price movers, and the Bespoke Market Timing Model. This week, we’ve added a section that helps break down momentum in developed market foreign exchange crosses.

The Closer is one of our most popular reports, and you can sign up for a free trial below to see it!
See tonight’s Closer by starting a two-week free trial to Bespoke Institutional now!
Double-Digit Year/Year Declines in the Dollar
The falling dollar has become a hot topic of conversation this week as back and forth comments from Treasury Secretary Mnuchin regarding the Administration’s view on the greenback caused some confusion in markets and among investors. While the dollar has been weak to kick off 2018, it is only the continuation of the same trend we saw in 2017 after the US Dollar Index peaked in late 2016 right after the election of President Trump.
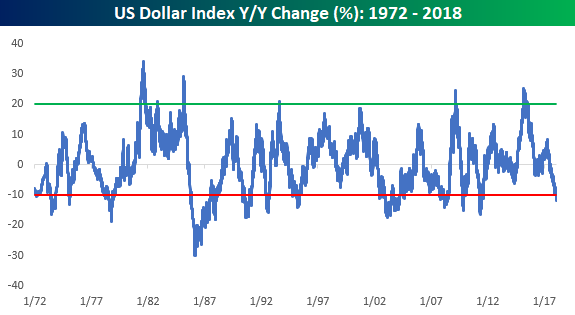
The chart below shows the y/y change in the US Dollar Index going back to 1972 where readings below the red line indicate y/y declines of more than 10% and readings above the green line indicate periods when the US Dollar Index was up over 20% y/y. With a decline of 11.64% since this point last year, the Dollar Index is seeing its worst y/y decline since June 2011 when financial markets were growing skittish about the impasse over the budget and debt ceiling in Congress. Looking back over time, though, a double-digit percentage decline in the US Dollar Index is not too uncommon. In the last 46 years, there have been 12 distinct periods where the US Dollar Index was down by as much or even more than the decline over the last year.
What is a lot less common than the recent decline in the US Dollar Index, however, is the magnitude of the gain that preceded it. Back in mid-2015, the US Dollar Index was up over 20% on y/y basis for its strongest one-year gain since the lows of the Financial Crisis, and before that, there were only four other periods where the dollar rallied by a similar magnitude. Like just about every other strong rally in the US Dollar Index, the one in 2015 was also met with a period of weakness/mean reversion.
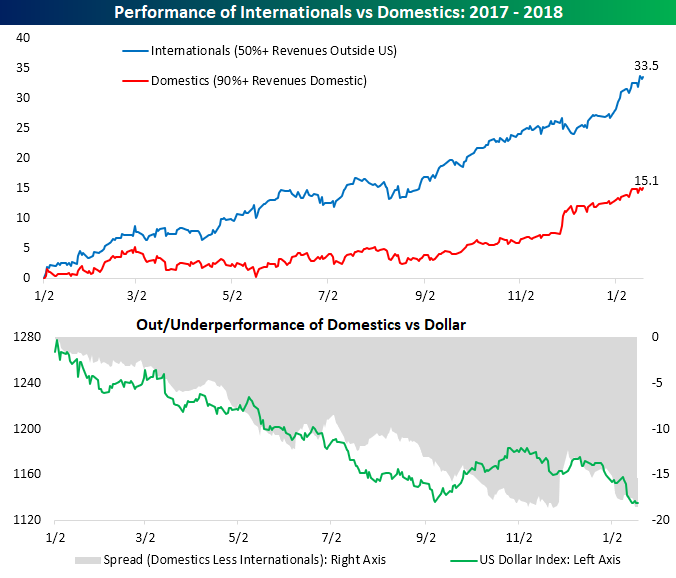
When it comes to the dollar, its moves have a big impact on stock price performance. Using our International Revenues Database (available to Premium and Institutional members), we have created two baskets of S&P 500 stocks. The first one – Domestics – is comprised of companies that generate 90% or more of their revenues inside the United States. The other basket – Internationals – is made up S&P 500 stocks that derive more than half of their revenue outside the United States. The chart below summarizes the performance of both baskets since the start of 2017, just when the US Dollar Index was peaking. Looking at the results, the performance figures aren’t even close. While the Domestics have seen a gain of just over 15% during this span, the International basket has more than doubled that with a gain of 33.5%!
To see just how closely correlated stock performance based on revenue exposure is to moves in the dollar, the lower chart compares the spread in performance between the Domestics and the Internationals to the US Dollar Index. Outside of a brief period towards the end of 2017 when the tax reform bill was moving through Congress, whenever the dollar declines, Domestics underperform Internationals and vice versa.
Which stocks stand to benefit and lose when the dollar rallies or declines? If you start a 14-day free trial to Bespoke Institutional, you can use our International Revenues Database right now to screen the Russell 1000 for yourself.
The Closer –New Home Supply, Euro Drivers — 1/25/18
Log-in here if you’re a member with access to the Closer.
Looking for deeper insight on markets? In tonight’s Closer sent to Bespoke Institutional clients, we breakdown the new home sales release today from the US Census. We also discuss the backdrop of the euro after some wild price action in response to the ECB today.

See today’s post-market Closer and everything else Bespoke publishes by starting a 14-day free trial to Bespoke Institutional today!
Bespoke’s Sector Snapshot — 1/25/18
We’ve just released our weekly Sector Snapshot report (see a sample here) for Bespoke Premium and Bespoke Institutional members. Please log-in here to view the report if you’re already a member. If you’re not yet a subscriber and would like to see the report, please start a two-week free trial to Bespoke Premium now.
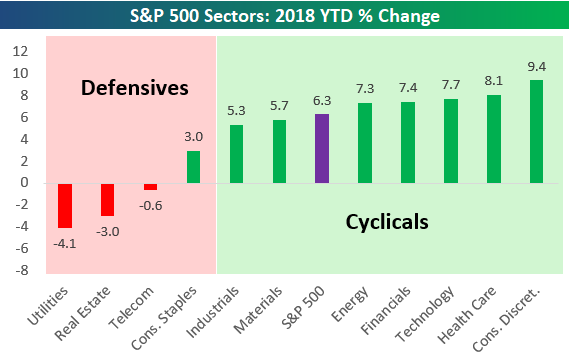
Below is one of the many charts included in this week’s Sector Snapshot, which highlights the year-to-date percentage change for the S&P 500 and its eleven sectors. As you can see, the Consumer Discretionary sector has exploded higher this year with a gain of 9.4% already! That’s extremely impressive given that we’re not even out of January yet.
To see our full Sector Snapshot with additional commentary plus six pages of charts that include analysis of valuations, breadth, technicals, and relative strength, start a two-week free trial to our Bespoke Premium package now. Here’s a breakdown of the products you’ll receive.
Bespoke Short Interest Report – 1/25/18
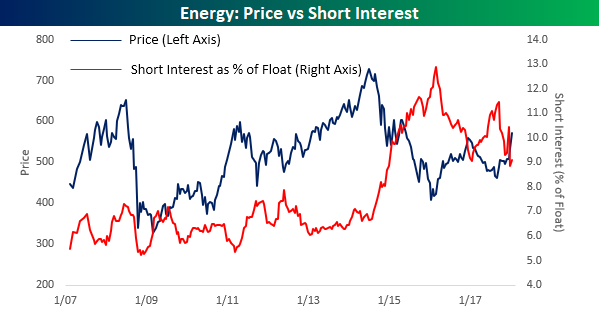
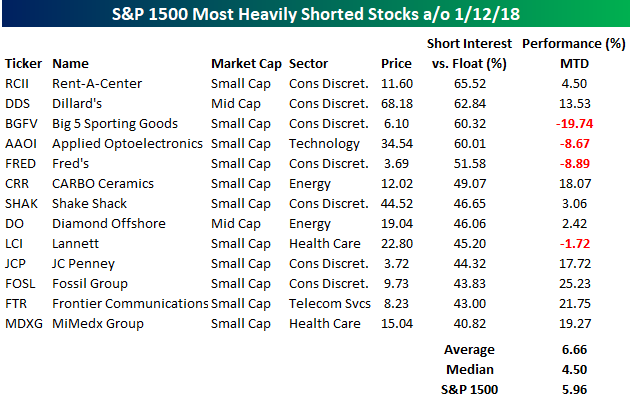
Short interest figures for the middle of January were released after the close on Wednesday, so we have just updated our regular report on short interest trends for the market, sectors, and individual stocks for clients. Below we wanted to quickly highlight how trends in short interest for the Energy sector have changed over the last several months as well as provide a snapshot of the stocks with the highest levels of short interest as a percentage of float. The top chart compares the average short interest as a percentage of float for S&P 1500 Energy sector stocks since 2007, and the table below lists the 13 stocks in the S&P 1500 that have more than 40% of their float sold shortThe list below shows the 23 stocks in the S&P 1500 that have more than a third of their free-floating shares sold short.
Starting with the Energy sector, investor concerns toward the sector have really abated since early 2016 when the average stock in the sector had nearly 13% of its float sold short. That peak in short interest occurred right at the lows, and since then short interest has drifted lower as prices have rallied. What’s interesting to note, though, is that at current levels average short interest on stocks in the sector is still elevated relative to the sector’s history before the crash in prices. Before 2015, average SIPF levels moved in a range of between 5% and just over 7%. Therefore, if the sector has stabilized, it seems as though there are still a number of shorts hanging on hopting for another leg lower in prices. If you are bullish on Energy, this is a positive contrarian signal.
In terms of the stocks with the highest levels of short interest (as a percentage of float, Rent-A-Center (RCII) tops the list with close to two-third of its float sold short. Right behind RCII, another three stocks have more than 60% of their float sold short. Those are high readings! It’s not a surprise that three of the four stocks at the top of the list are form the Consumer Discretionary sector, and in total that sector accounts for seven of the thirteen names listed.
In terms of performance, the most shorted stocks are up an ominous average of 6.66% so far this year, which is slightly ahead of the S&P 1500 as a whole. Despite all the negativity towards the Consumer Discretionary sector, though, five of the seven names on the list are up so far in 2018, so they have been a positive influence on the overall performance.
For a more detailed look at short interest data on a regular basis, sign up for a monthly Bespoke Premium membership now!