S&P 500 Stock Seasonality – 12/26/17
While we don’t ever suggest that investors should base their trading solely on the calendar, there is evidence that the market and many stocks do indeed follow seasonal patterns. This makes our S&P 500 Stock Seasonality report a useful addition to every investor’s toolbox. Using the last ten years worth of price data, our Stock Seasonality report looks at the average returns for the S&P 500, its ten sectors, and its 500 individual stocks. In the report, we highlight the five stocks in each sector that have historically been the best and worst performers over the next two weeks. For each stock, we also include information such as average returns, the percent of time each stock or sector is positive/outperforms the S&P 500, and its historical performance over the next two weeks for each of the last ten years. The Stock Seasonality report is published on a weekly basis on Mondays, and it is available to all Bespoke Premium and Bespoke Institutional subscribers.
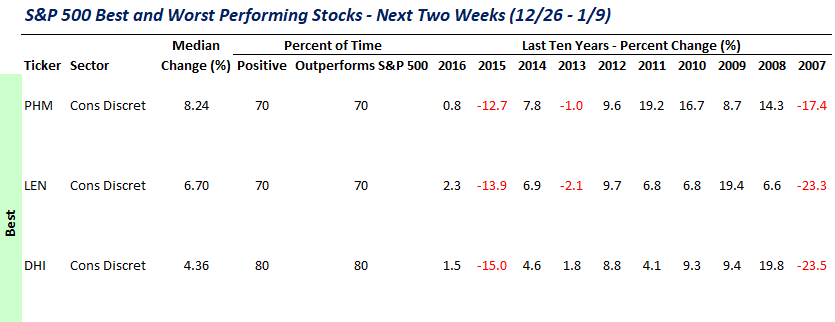
One section of the Stock Seasonality report that we wanted to highlight this week is the one where we highlight the fifteen stocks in the S&P 500 that have historically performed the best during the upcoming two-week period. The table below shows this week’s section with three of the names that made the list showing. As shown, homebuilders Pulte (PHM), Lennar (LEN), and DR Horton (DHI) have all seen median gains during the upcoming two-week period ranging from 4.36% up to 8.24%. So, even though the late December/early January period is probably one of the worst times of year to be outside building a house, for the stocks of homebuilders, it has been a great time of year!
For active traders, our Stock Seasonality report is an excellent tool keep track of the best and worst times of year for the overall market, sectors, and individual stocks. To see the report, sign up for a monthly Bespoke Premium membership now!
Bespoke Stock Scores — 12/26/17
[Used to Be] The Most Wonderful Time of the Year
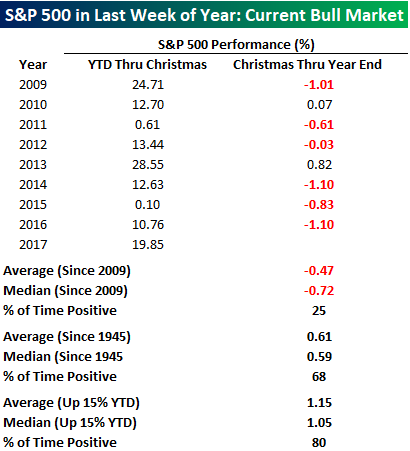
When it comes to the stock market, the period before and after Christmas has historically been a great time of year to be long equities. After all, the term Santa Claus Rally didn’t just come up out of nowhere. Recently, though, not so much. Despite being in one of the longest and strongest bull markets on record, the last week of the year between Christmas and New Years has been more Scrooge than Santa. The table below lists the performance of the S&P 500 for each year during the current bull market from the start of the year through Christmas and then from Christmas through year-end.
Since the bull market began in 2009, there has not been a single year where the S&P 500 was down YTD as of Christmas, but there have only been two years where the index traded in the black from Christmas through year-end. Overall, the index’s average return in the last week of the year has been a decline of 0.47% (median: -0.72%). That’s not the way it has always been, though. In the interest of space, we didn’t list every year, but we have included the results in the table, and since 1945, the S&P 500 has seen an average gain of 0.61% (median: 0.59%) in the last week of the year with gains over two-thirds of the time. Finally, with the S&P 500 up close to 20% in 2017, we also looked at the index’s performance in the last week of the year when it was already up at least 15% YTD. In those 25 years, the S&P 500 saw an average last week gain of 1.15% (median: 1.05%) with gains 80% of the time. Those are some pretty consistent results, but here again, we would note that in the current bull market, the results haven’t been as positive. Since 2009, there have been two years where the S&P 500 was up over 15% YTD (2009 and 2013) as of Christmas. In 2009, the S&P 500 traded down 1.01% in the last week of the year, while in 2013 it finished the year with a gain of 0.82% in the final week.
2017 Total Return Performance by Asset Class Using Key ETFs
Sign up for our Annual Outlook Special to see our view on markets and the economy for 2018 and beyond.
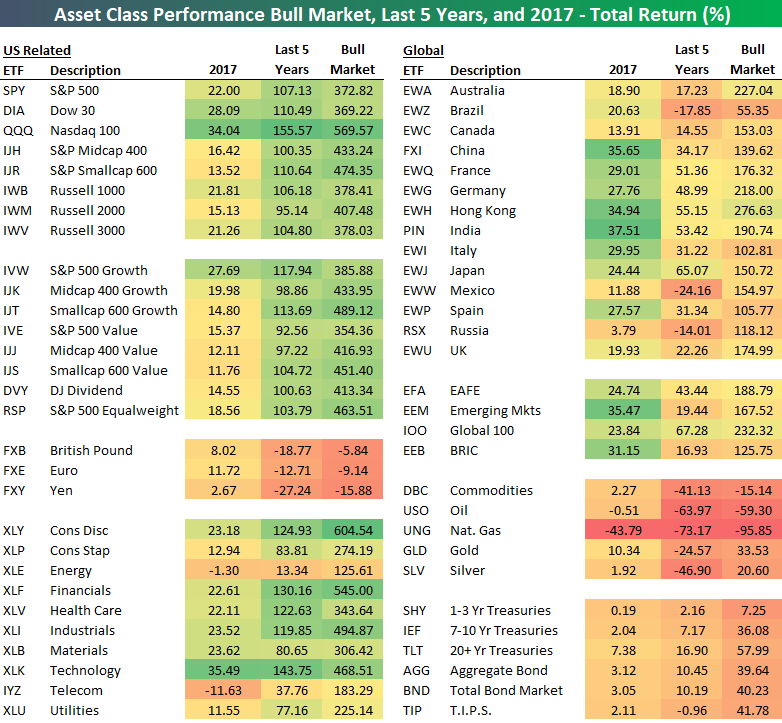
Below is an easy-to-read matrix of key ETFs highlighting the total return performance of various asset classes in 2017, over the last 5 years, and during the entire bull market that began on March 9th, 2009.
Looking at the entire bull market, most of the green is on the left side where the US-related equity indices and sectors are. The Consumer Discretionary ETF (XLY) is up more than any other ETF during the bull market with a total return of 604%. The Nasdaq 100 (QQQ) is up second most at +570%. The natural gas ETF (UNG) is down the most during the bull market, losing 95% of its value. The oil ETF (USO) is down the second most at –59%.
The Nasdaq 100 (QQQ) is up the most over the last 5 years with a gain of 155%, and it ranks sixth in 2017 with a gain of 34%. In terms of market cap, large cap indices did better than small and mid caps in 2017, while growth easily outperformed value. Energy and Telecom are the only two sectors down in 2017 (through Christmas). Outside of the US, emerging markets have had a banner year, with EEM up 35.5%. India is up more than any ETF in the matrix in 2017 with a gain of 37.5%, followed by China (FXI) at +35.65%. Russia (RSX) is up the least of any country ETF with a 2017 gain of just 3.8%.
Commodities are ending 2017 relatively flat. The oil ETF (USO) is slightly down on the year, while natural gas (UNG) is down 44%. Gold (GLD) has posted a nice gain of 10%, but silver (SLV) is up just 1.9%. Looking at Treasury ETFs, the 20+Year Treasury (TLT) has posted a total return of 7.4% on the year. Not bad for a “risk-free” asset!
Happy Holidays!
Bespoke Brunch Reads: 12/24/17
Welcome to Bespoke Brunch Reads — a linkfest of the favorite things we read over the past week. The links are mostly market related, but there are some other interesting subjects covered as well. We hope you enjoy the food for thought as a supplement to the research we provide you during the week.
Politics
Some Change In Apportionment Allocations With New 2017 Census Estimates; But Greater Change Likely By 2020 (Election Data Services)
With updated Census population data released this week, EDS has made new estimates for changes in the number of House representatives in each state, a process which also effects the Electoral College. Final changes won’t be made until data from the 2020 Census is in. [Link; 15 page PDF]
Welcoming the pro-EU far-right by Mehreen Khan (FT)
While Americans may view the EU as a monolithic left-wing entity, the reality is much, much more complicated. This week’s near-literal embrace of the pro-EU right wing in Austria is a good example of the complexity. [Link]
Research
Why so low for so long? A long-term view of real interest rates by Claudio Borio, Piti Disyatat, Mikael Juselius and Phurichai Rungcharoenkitkul (BIS Working Papers)
A new paper for the Bank of International Settlements argues that monetary policy is more responsible for large shifts in real interest rates than demographic or savings and investment based models. [Link; 73 page PDF]
Taxes
How Tax Cuts Affect Revenue by Nick Timiraos and Youjin Shin (WSJ)
A nice recap of the estimated and actual changes to the federal budget based on two past major tax reforms. [Link; paywall]
How the Maker of TurboTax Fought Free, Simple Tax Filing by Liz Day (ProPublica)
A summary of the role the tax preparation industry plays in keeping your taxes complicated and hard to fill out every spring. [Link]
Failbook
Facebook ditches fake news flag after admitting it was making the problem worse by Margi Murphy (Telegraph)
A program to identify news from untrustworthy sources at Facebook actually reinforced the message of the misinformation to users. [Link]
Dozens of Companies Are Using Facebook to Exclude Older Workers From Job Ads by Julia Angwinn Noam Scheiber, and Ariana Tobin (ProPublica)
Employers have used Facebook’s ad targeting features to present job ads to narrow demographic groups, a possible violation of employment discrimination law. [Link]
Law & Order
Shot By Cops And Forgotten (Vice)
A data intensive summary of police shootings in large police departments across the country. From 2010 to 2016 police shot at more that 4000 people, killing more than 1300. Rates of police shootings relative to population vary dramatically across the country with Newark, St. Louis, and New Orleans standing out on the high side while Fairfax Country, Boston, and New York are relatively low. [Link]
Natural World
The Year From Above by K.K. Rebecca Lai and Tim Wallace (NYT)
A breathtaking lineup of pictures from space including weather, economics, climate, geopolitics, and astronomy. [Link; soft paywall]
What is dead may never die by Jake Parks (Astronomy)
A star has been observed going supernova twice in the past 60 years, in a series of events astronomers had thought were impossible. [Link]
Going Viral
A Federal Ban on Making Lethal Viruses Is Lifted by Donald G. McNeil Jr (NYT)
This week federal officials ended a three year old moratorium on funding research to make viruses more lethal to humans. [Link; soft paywall]
Nosh
The Crunchy Rice at the Bottom of the Pot, How Different Cultures Cook and Eat It (Bon Appetit)
Modern pots and rice cookers have made the crispy, golden rice which used to form at the bottom of pans less common, and that’s a darn shame. [Link]
AI
AI System Detects ‘Deception’ in Courtroom Videos by Michael Byrne (Motherboard)
A new system claims high accuracy at assessing truthfulness, but the pseudo-science surrounding the traditional polygraph doesn’t exactly leave us optimistic. [Link]
Have a great Sunday and a Merry Christmas!
The Bespoke Report 2018 — Annual Outlook
 Our 2018 Bespoke Report market outlook is the most important piece of research that Bespoke publishes each year. We’ve been publishing our annual outlook piece since the formation of Bespoke in 2007, and it gets better and better each year! In this year’s edition, we cover every important topic you can think of dealing with financial markets as we enter 2018.
The 2018 Bespoke Report contains sections like Washington and Markets, Economic Cycles, Market Cycles, The Fed, Sector Technicals and Weightings, Stock Market Sentiment, Stock Market Seasonality, Housing, Commodities, and more. In this year’s edition, we have a section on Bitcoin/Cryptocurrencies as well.
Our annual outlook report is simply a must read for any serious investor. If you’re not already a Bespoke research subscriber, you can read the full report now by signing up with our 2018 Annual Outlook Special. With this special, you’ll get your first 14 days of any membership level free along with a 20% off lifetime discount if you choose to stick with the service.
Start 2018 on a positive note knowing you’re fully informed on both the stock market and the economy!
The Bespoke Report 2018 — Our View/Introduction
Our 2018 Bespoke Report market outlook is the most important piece of research that Bespoke publishes each year. We’ve been publishing our annual outlook piece since the formation of Bespoke in 2007, and it gets better and better each year! In this year’s edition, we’ll be covering every important topic you can think of dealing with financial markets as we enter 2018.
The 2018 Bespoke Report contains sections like Washington and Markets, Economic Cycles, Market Cycles, The Fed, Sector Technicals and Weightings, Stock Market Sentiment, Stock Market Seasonality, Housing, Commodities, and more. In this year’s edition, we’ll also be featuring a Bitcoin/Crypto section as well as an ETF Trends report.
Today we have published the “Our View” section of the 2018 Bespoke Report, which highlights our unique expectations for the market and the economy as we head into 2018. If there’s a section of our outlook report that you’ll want to read, it’s most certainly this one.
To view this section immediately and also receive the full 2018 Bespoke Report when it’s published on December 22nd, sign up for our 2018 Annual Outlook Special below.
The Bespoke Report 2018 — Analyst Ratings
Our 2018 Bespoke Report market outlook is the most important piece of research that Bespoke publishes each year. We’ve been publishing our annual outlook piece since the formation of Bespoke in 2007, and it gets better and better each year! In this year’s edition, we’ll be covering every important topic you can think of dealing with financial markets as we enter 2018.
The 2018 Bespoke Report contains sections like Washington and Markets, Economic Cycles, Market Cycles, The Fed, Sector Technicals and Weightings, Stock Market Sentiment, Stock Market Seasonality, Housing, Commodities, and more. In this year’s edition, we’ll also be featuring a Bitcoin/Crypto section as well as an ETF Trends report.
We’ll be releasing individual sections of the report to subscribers until the full publication is released on December 22nd, 2017. Today we have published the “Analyst Ratings” section of the 2018 Bespoke Report, which looks at the percentage of buy, hold, and sell ratings for US stocks and sectors and how analyst sentiment has changed over the last year.
To view this section immediately and also receive the full 2018 Bespoke Report when it’s published on December 22nd, sign up for our 2018 Annual Outlook Special below.
S&P 500 Quick-View Chart Book: 12/22/17
The Bespoke Report 2018 — Market Cycles
Our 2018 Bespoke Report market outlook is the most important piece of research that Bespoke publishes each year. We’ve been publishing our annual outlook piece since the formation of Bespoke in 2007, and it gets better and better each year! In this year’s edition, we’ll be covering every important topic you can think of dealing with financial markets as we enter 2018.
The 2018 Bespoke Report contains sections like Washington and Markets, Economic Cycles, Market Cycles, The Fed, Sector Technicals and Weightings, Stock Market Sentiment, Stock Market Seasonality, Housing, Commodities, and more. In this year’s edition, we’ll also be featuring a Bitcoin/Crypto section as well as an ETF Trends report.
We’ll be releasing individual sections of the report to subscribers until the full publication is released on December 22nd, 2017. Today we have published the “Market Cycles” section of the 2018 Bespoke Report, which looks at where we stand in the current bull market and how it compares to past market cycles.
To view this section immediately and also receive the full 2018 Bespoke Report when it’s published on December 22nd, sign up for our 2018 Annual Outlook Special below.