Best and Worst Performing S&P 500 Stocks in 2017
While the cap-weighted S&P 500 gained 19.42% on the year, the average stock in the index was up less than that at just over 18%.
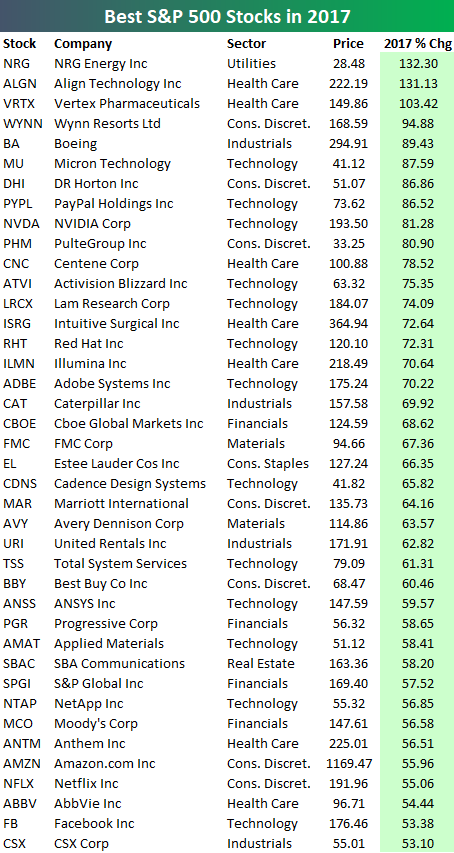
There were exactly 50 stocks in the S&P that gained more than 50% on the year, and there were only 3 that gained more than 100%. We were a bit surprised that only 3 stocks posted triple-digit returns given the year that markets had. We were even more surprised to see a Utilities stock at the top of the best performers list! That’s right — NRG Energy (NRG) was the top performing stock in the S&P 500 in 2017 with a gain of 132.3%. The other two triple-digit gainers were Align Tech (ALGN), and Vertex Pharma (VRTX). Wynn Resorts (WYNN) and Boeing (BA) rounded out the top five with gains of 94.88% and 89.43%, respectively.
Other notables on the list of S&P 500 winners include NVIDIA (NVDA), Activision Blizzard (ATVI), Adobe (ADBE), Caterpillar (CAT), Best Buy (BBY), Amazon (AMZN), Netflix (NFLX), and Facebook (FB). All of these names gained more than 50% in 2017.
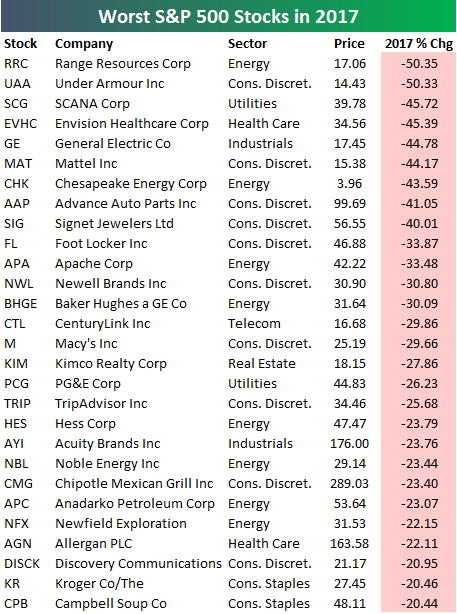
It’s tough in any year to be on the loser’s list, but it’s even tougher in a year when the S&P gains as much as it did this year. Below is a list of the S&P 500 stocks that fell more than 20% in 2017. Range Resources (RRC) and Under Armour (UAA) top the list with declines of 50%+. General Electric (GE) is by far the most high-profile name on the list of losers with a huge drop of 44.78%. Other notable losers include Mattel (MAT), Macy’s (M), Baker Hughes (BHGE), Foot Locker (FL), TripAdvisor (TRIP), Chipotle (CMG), and Campbell Soup (CPB).
2017 Asset Class Total Return Performance
Below are the final total return numbers in 2017 for various asset classes using our key ETF matrix. Use our Trend Analyzer tool to monitor our proprietary Trend and Timing ratings for each of the ETFs shown (plus every stock in the S&P 500, Dow 30, and Nasdaq 100).
While the Nasdaq 100 (QQQ) was the worst performing asset class in the final week of the year, it finished 2017 with a total return of 32.66%. That’s the biggest gainer of the US index ETFs we track.
The S&P 500 Growth ETF (IVW) easily outperformed all other growth and value ETFs across large caps, mid caps, and small caps. From a sector perspective, Tech (XLK) gained the most in 2017 followed by Materials (XLB) and Industrials (XLI). Energy (XLE) and Telecom (IYZ) both finished the year in the red.
Outside of the US, India (PIN), Hong Kong (EWH), and China (ASHR) were up the most in 2017, while Russia (RSX) was up the least. Emerging markets (EEM) had an excellent year with a gain of 37.28%. Natural gas (UNG), on the other hand, had a brutal year with a decline of 37.58%.
Finally, fixed income ETFs all posted single-digit positive returns, with TLT gaining the most at +9.18%.
Happy New Year and best of luck in 2018!

S&P 500 Quick-View Chartbook: 12/29/17
B.I.G. Tips — January 2018 Seasonality
Does a Reversion to the Mean Follow Big Up Years?
With just a few hours left in the trading day, the S&P 500 is on track to deliver a hefty gain of over 20% to investors for 2017 and the ninth straight year of gains on a total return basis. In the S&P 500’s history, there has only been one other period where the S&P 500 was in the black for nine straight years, and that was from 1991 to 1999. A big difference between that streak and now, though, is the magnitude of the gains. During the 1990s streak, the S&P 500’s total return was 450% compared to a relatively meager gain of 261% in the current period. If the S&P 500 does make further gains next year, it will be the first ten-year winning streak for the index ever. With such a big gain this year, though, can investors really expect to see gains in the year ahead?
Looking back at the S&P 500’s historical total returns, there have been 32 prior years where the index was up 20% on a total return basis. What’s stunning about this number is the frequency of these types of big years. In fact, there have been 33% more years where the S&P 500 was up 20% or more than years where it was down! The table below lists every year since 1928 where the S&P 500 was up over 20% on a total return basis along with how the index performed in the following year. In the year that followed these ‘big’ years, the index saw an average gain of 10.46% (median: 12.80%) with positive returns just over two-thirds of the time. What’s pretty surprising about these prior returns is that they are only modestly below the average (11.85%) and median (14.30%) total returns of the S&P 500 following years where the index was not up 20% or more. So if it’s a reversion to the mean you are expecting following this year’s big gain, you may be disappointed. In fact, there have been five periods where a 20%+ year was followed by another 20%+ year, and in one of those five periods, the 20%+ year was followed by another four 20%+ years!

Bitcoin’s Big Rallies
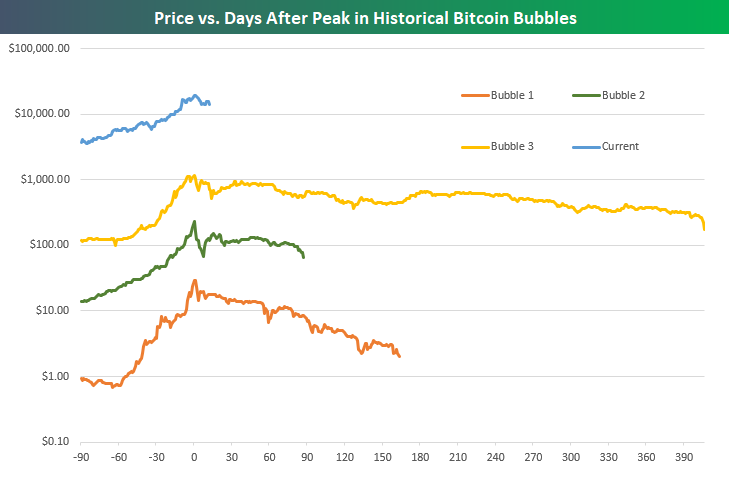
Those who have been around the crypto block know that this isn’t bitcoin’s first rodeo with big price swings. Below is a comparison of past “bubble moves” for Bitcoin’s price. Of course, the volume of bitcoin traded during past bubbles is nowhere near current volume, but the investor psychology remains the same.

Below is a chart of the price movements for the circled bubbles above, labeled in chronological order. On the Y axis is price for a single bitcoin, and the X axis is days before and after the peak of the rally. The chart shows price 90 days prior to the local peak, as well as the price into the next low between peaks. Note that the price is charted using a logarithmic scale, so the distance between one major interval to the next represents a tenfold change in price. While it’s notoriously hard to call a top, especially in the cryptocurrency world, historical comparisons to recent price action look like a bearish signal for the near term.
Bespoke CNBC Appearance (12/28)
Bespoke co-founder Paul Hickey appeared on CNBC’s Power Lunch yesterday (12/28) to discuss markets and the outlook for 2018. The conversation then drifted to the topic of what else? Bitcoin!

The Closer — Modeled ISM, Inventories, & Trade — 12/28/17
Log-in here if you’re a member with access to the Closer.
Looking for deeper insight on markets? In tonight’s Closer sent to Bespoke Institutional clients, we review advance economic indicators from the US Census and what the Chicago PMI suggests about the ISM Manufacturing report due next week.

See today’s post-market Closer and everything else Bespoke publishes by starting a 14-day free trial to Bespoke Institutional today!