The Closer — JOLTS, Mexican Inflation, Utilities Set-Ups — 1/9/18
Log-in here if you’re a member with access to the Closer.
Looking for deeper insight on markets? In tonight’s Closer sent to Bespoke Institutional clients, we take a look at the JOLTS report, review Mexican inflation, and discuss a new example of our Trend Analyzer tool.

See today’s post-market Closer and everything else Bespoke publishes by starting a 14-day free trial to Bespoke Institutional today!
B.I.G. Tips – Analyst Sentiment Heading into Earnings Season
Earnings season kicks off this week as the first of the major companies start to report Q3 numbers. Most of the big names reporting are all Financials like Blackrock (BLK), JP Morgan (JPM), PNC, and Wells Fargo (WFC) on Friday, but we will also hear results from other notables like Lennar (LEN) and KB Home (KBH) on Wednesday and then Delta (DAL) on Thursday.
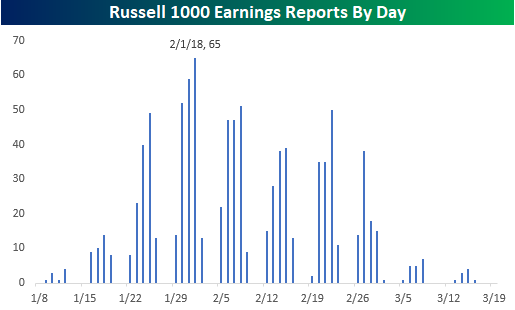
The pace of reports really won’t pick up until the week after next when 133 companies in the Russell 1000 are on the calendar. Then, we get into the peak reporting period in the last week of January/first week of February when 379 companies in the index will report from 1/29 through 2/9. The busiest day in that two-week stretch will be on 2/1 when 65 companies in the Russell 1000 will report. For a more detailed rundown of the earnings schedule for the upcoming season, please see our Interactive Earnings Calendar.
We just published our quarterly look at analyst revisions heading into this earnings season. In this report, we take the current trends and break down how the equity market has performed during prior periods when analyst revisions were at similar levels.
For anyone with more than a passing interest in how equities are impacted by earnings season, this report is a must-read. To see the report, sign up for a Bespoke Premium membership now!
Financial Sector Earnings Reports on Deck
Less than 100 companies will report earnings between now and next Friday, but this week mark’s the official kick-off to the Q4 2017 earnings reporting season. Below is a list of the 30 largest companies set to report between now and January 19th. As you can see, the bulk of large-cap companies set to report over the next 10 days are in the Financial sector.
On Friday alone, we’ll hear from JP Morgan (JPM), Wells Fargo (WFC), BlackRock (BLK), and PNC. How these Financials react to their earnings reports will be an important early signal as to how investors plan to trade earnings this season. As we highlighted yesterday in a Chart of the Day, analysts have gotten extremely bullish ahead of this earnings season, hiking EPS estimates at their fastest pace in ten years. (Bloomberg featured our data in an article on this topic this morning.)
The data included in our table below is pulled from our Interactive Earnings Calendar (which you can use this earnings season by starting a 14-day free trial to Bespoke Premium). For each stock, we show its estimated report date and time, its EPS and revenue estimate, and its historical earnings and revenue beat rate (% of time it has beaten consensus estimates). We also show how the stock has historically traded on its earnings reaction days, which is the first trading day following its past quarterly reports.
As you can see in the table, UnitedHealth (UNH), Goldman Sachs (GS), JP Morgan (JPM), and Synchrony Financial (SYF) are the stocks set to report soon that have historically beaten EPS estimates the most often. In terms of price reactions, Delta Air Lines (DAL), BlackRock (BLK), CSX, Morgan Stanley (MS), KeyCorp (KEY), and Canadian Pacific (CP) have historically gone up the most on their earnings reaction days. Interactive Brokers (IBKR), Bank of America (BAC), and IBM have historically reacted the most negatively to earnings reports.

Chart of the Day: Department Stumble
Bespoke Stock Scores — 1/9/18
Bespoke CNBC Appearance (1/9)
Bespoke co-founder Paul Hickey appeared on CNBC’s Squawk Box earlier today to discuss markets and the new year. To view the clip please click on the image below.

The Closer — Valuation Check-Up, Markets Behind Fed’s Curve, Consumer Credit — 1/8/18
Log-in here if you’re a member with access to the Closer.
Looking for deeper insight on markets? In tonight’s Closer sent to Bespoke Institutional clients, we review small and large cap valuations, the markets’ accuracy forecasting the Fed’s rate actions, monthly consumer credit data, and our new Trend Analyzer tool.
See today’s post-market Closer and everything else Bespoke publishes by starting a 14-day free trial to Bespoke Institutional today!
US Market Cap Approaches $30 Trillion
The market cap of the Russell 3,000, which contains roughly 98.5% of US stock market cap, is currently at $29.99 trillion.
Below is a chart showing the historical market cap of the Russell 3,000 since Bush II officially won the 2000 election on December 12th, 2000. As shown, the index’s market cap ended up falling $3.31 trillion under Bush II due to the Financial Crisis at the end of his 2nd term. Stock market cap grew by $12.33 trillion from the time Obama was elected in November 2008 through November 2016. And finally, US stocks have increased by $6.26 trillion in market cap since Trump won the Presidency on November 8th, 2016.
From the low point of the Financial Crisis on March 9th, 2009, US stock market cap has grown from $7.6 trillion up to $29.99 trillion — easily the biggest creation of stock market wealth in history.
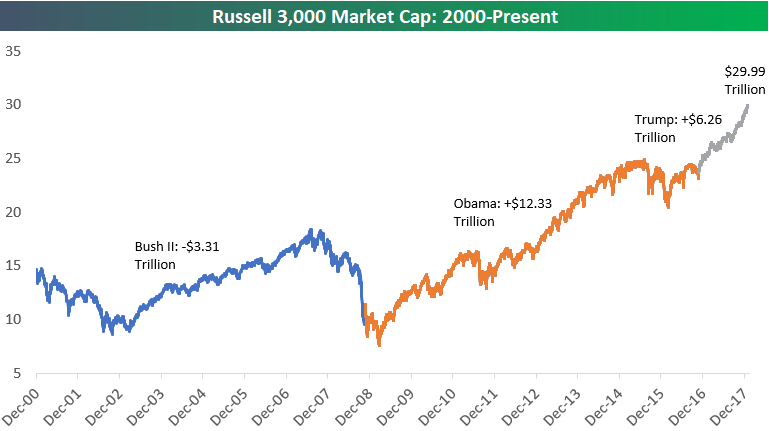
Chart of the Day: Analyst Sentiment Surges
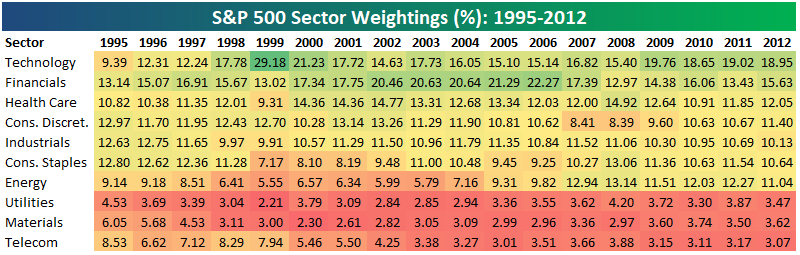
Bespoke S&P 500 Sector Weightings Report — January 2018
S&P 500 sector weightings are important to monitor. Over the years when weightings have gotten extremely lopsided for one or two sectors, it hasn’t ended well. Below is a table showing S&P 500 sector weightings from the mid-1990s through 2012. In the early 1990s before the Dot Com bubble, the US economy was much more evenly weighted between manufacturing sectors and service sectors. Sector weightings were bunched together between 6% and 14% across the board. In 1990, Tech was tied for the smallest sector of the market at 6.3%, while Industrials was the largest at 14.7%. The spread between the largest and smallest sectors back then was just over 8 percentage points.
The Dot Com bubble completely blew up the balanced economy, and looking back you can clearly see how lopsided things had become. Once the Tech bubble burst, it was the Financial sector that began its charge towards dominance. The Financial sector’s sole purpose is to service the economy, so in our view you never want to see the Financial sector make up the largest portion of the economy. That was the case from 2002 to 2007, though, and we all know how that ended.
Unfortunately we’ve begun to see sector weightings get extremely out of whack once again.
If you would like to see the most up-to-date numbers for S&P 500 sector weightings, simply start a two-week free trial to our Bespoke Premium or Bespoke Institutional service. Click back to this post once you’re signed up to see the numbers.