Gold (GLD) and S&P 500 (SPY) Both Volatile
It’s been a volatile year for stocks so far, but more surprising is that gold prices, which have rallied more than 25% YTD, have been even more volatile. Year to date, the SPDR Gold Trust (GLD) has experienced a daily move of at least 1% on 40% of all trading days compared to 37% for the S&P 500, as measured by the SPDR S&P 500 ETF (SPY).
The chart below shows the rolling 50-day average number of daily 1% moves in GLD over the last 20 years. The current level of 54% is modestly below the recent high of 56%, and that was the highest frequency of daily 1% moves since late 2011! The second chart shows the same calculation for SPY over the last 20 years. While the current level of 42% is hardly extreme relative to history, earlier this month it was at 52%.
In both charts, areas where the line shifts from blue to red indicate periods when both GLD and SPY had 1%+ daily moves on more than 40% of trading days in a rolling 50-day period. The only periods in the last 20 years when both ETFs simultaneously had 1%+ daily moves over 50 days were during the Financial Crisis, late 2011 after S&P downgraded the US AAA credit rating, early 2016, Covid, and now.


The chart below shows the performance of GLD over the last 20 years, and here again, the red line indicates the periods when both GLD and SPY had 1%+ daily moves at least 40% of the time over a 50-day span. For GLD, there was no consistent pattern of performance leading up to or after these periods.

For the S&P 500, however, the pattern surrounding these occurrences was more consistent. Except the Financial crisis when elevated levels of volatility in both ETFs started just after the S&P 500’s peak and continued for most of the bear market, in the three other periods (and the current period), it wasn’t until late in the decline or after the market made its low that the average number of 1% daily moves in each ETF exceeded 40%.

Click below to watch a video from our “Get Invested” series that covers some of the benefits of long-term investing in the stock market. To become a Bespoke client, start a trial to one of our membership options or visit our Wealth Management page for more info on how we may be of help.

Bespoke’s Morning Lineup – 5/23/25 – Early Summer Fireworks
See what’s driving market performance around the world in today’s Morning Lineup. Bespoke’s Morning Lineup is the best way to start your trading day. Read it now by starting a two-week trial to Bespoke Premium. CLICK HERE to learn more and start your trial.
“If you want to keep your memories, you first have to live them.”– Bob Dylan

Below is a snippet of commentary from today’s Morning Lineup. Start a two-week trial to Bespoke Premium to view the full report.
Can you feel it? It may not feel like it in many parts of the country, but the unofficial start to summer kicks off in less than eight hours as the three-day Memorial Day weekend kicks off. There’s still one more trading day left in the week, though, and futures have been moving lower this morning and just recently took two legs lower. The first followed a Truth Social post from the President saying, “I have long ago informed Tim Cook of Apple that I expect their iPhone’s that will be sold in the United States of America will be manufactured and built in the United States, not India, or anyplace else. If that is not the case, a tariff of at least 25% must be paid by Apple to the U.S.” In response to that post, shares of Apple (AAPL) plunged over 3% and took the Nasdaq down with it.
Shortly after that, the President shifted his attention to the EU, saying, “Our discussions with them are going nowhere! Therefore, I am recommending a straight 50% Tariff on the European Union, starting on June 1, 2025.” As you can imagine, that didn’t help matters, and futures took another leg lower, but stocks in Europe are down even more, with the STOXX 600 down 2%. Interestingly, while the S&P 500 was firmly higher, heading into the final half hour of trading yesterday, it fell sharply into the close, finishing the day slightly lower. Did somebody have wind of these Truth Social posts beforehand? We may have a three-day weekend coming up, but the President can post at any time…
This morning’s earnings and economic calendar are on the light side with little in the way of earnings reports, and the only economic report on the calendar is New Home Sales at 10 AM.
The period covering Memorial Day through Labor Day overlaps with the “Sell in May and go away” period, but the S&P 500’s performance during the unofficial summer period has generally been positive, most notably during years when the S&P 500 was already up YTD. The chart below shows the performance of the S&P 500 from the Friday before Memorial Day through the Friday before Labor Day over the last 50 years. The S&P 500’s median performance during this period has been a gain of 3.7%, with positive returns 72% of the time. In years when the S&P 500 was up YTD heading into the unofficial summer period, the S&P 500’s median performance was a gain of 4.3%, with positive returns 74% of the time. However, in the 15 years when the S&P 500 was down YTD, the median performance was just 1.4%, with gains 67% of the time.

Looking at the week after Memorial Day, the chart below shows the performance of the S&P 500 from the Friday before Memorial Day to the Friday after over the last 50 years. Overall, the S&P 500’s median performance has been a gain of 0.6% with positive returns 64% of the time, and there’s very little difference in performance depending on whether the S&P 500 was up or down YTD heading into the holiday weekend.

The Closer – Uncertainty, Bond Bath, Housing – 5/22/25
Log-in here if you’re a member with access to the Closer.
Looking for deeper insight into markets? In tonight’s Closer sent to Bespoke Institutional clients, we begin with a look at the still elevated readings in policy uncertainty (page 1) followed by a look into the latest PMI readings (page 2). After a dive into existing home sales (page 3) and affordability (page 4), we review IPO issuance and performance (page 5). We finish with a rundown of week to date and today’s performance in relation to bond correlation (page 6).

See today’s full post-market Closer and everything else Bespoke publishes by starting a 14-day trial to Bespoke Institutional today!
Bespoke’s Weekly Sector Snapshot — 5/22/25
Dividend Yields vs. Treasury Yields
While down a bit today, this week has seen a spike in long-term Treasury yields. Given the surge in yields, there has been a shake-up in the relationship between Treasury yields and dividend yields for stocks. As shown below, currently only 7.9% of stocks in the S&P 500 have dividend yields above the 10-year Treasury yield (4.59% at the time of writing). Additionally, only 12.1% of stocks in the index have dividend yields above that of the 2-year Treasury (4.0%).

Of course, yield dynamics are different for different sectors. As shown below, Real Estate has the highest percentage of stocks with dividend yields above the yield on the 10-year and 2-year. Energy, Utilities, and Materials are the sectors with the next largest shares, whereas cyclical groups like Tech, Industrials, and Consumer Discretionary hardly have any members with dividend yields larger than Treasury yields.

At the moment, there are 40 S&P 500 stocks with higher dividend yields than the 10-year yield, and we list them below. Two Materials stocks top the list with 9%+ dividend yields and over 20% declines on the year.

Like this post? Join our complimentary Dividend Discovery email newsletter to receive a dividend-centric post in your inbox a couple of times per week. If you’re interested in dividend stocks and ETFs, this newsletter is for you! CLICK HERE to sign up with just your email or click on the image below.

Chart of the Day – Filtering Out The Dregs
Bespoke’s Morning Lineup – 5/22/25 – Not the Breakout You Want to See
See what’s driving market performance around the world in today’s Morning Lineup. Bespoke’s Morning Lineup is the best way to start your trading day. Read it now by starting a two-week trial to Bespoke Premium. CLICK HERE to learn more and start your trial.
“The president wants lower rates… He and I are focused on the 10-year Treasury and what is the yield of that.” – Scott Bessent
Below is a snippet of commentary from today’s Morning Lineup. Start a two-week trial to Bespoke Premium to view the full report.
Equity futures have been weakening all morning as yields have risen. Oil prices are lower as OPEC+ mulls another production increase, and Bitcoin is above $111K. The House passed its tax bill, and we’re approaching a slew of economic data about to be released after what has to this point been a quiet week for data.
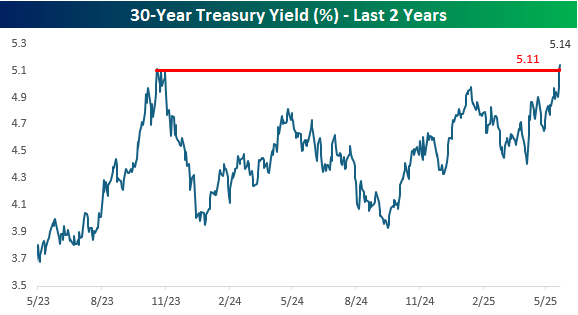
The President and Treasury Secretary may want and be focused on the level of yields, but that’s not what they’re getting. While the 10-year US Treasury yield still hasn’t reached a new high for the year, the 30-year yield broke out above resistance yesterday, trading as high as 5.11% and then adding to those gains this morning and reaching a yield of 5.14%. From a technical perspective, the move higher in yield looks like a textbook breakout, and if that pattern played out, it would suggest higher rates ahead.

From a longer-term perspective, 5.11% was an important level for the 30-year yield. Looking at a two-year chart, it represents the high from Q4 2023, and if current levels of 5.14% hold, we could be in for a new leg higher in yields, which would spell more headaches for equities.
The Closer – Aggressive Auction Losses, Retail Rebound – 5/21/25
Log-in here if you’re a member with access to the Closer.
Looking for deeper insight into markets? In tonight’s Closer sent to Bespoke Institutional clients, we start with a look at the historic reaction stocks had to today’s 20-year bond auction (page 1). We also show some other drivers of equity market performance (page 2) followed by a look into the big moves in retail stocks (page 3).

See today’s full post-market Closer and everything else Bespoke publishes by starting a 14-day trial to Bespoke Institutional today!