The Closer — Capplex, IP Trends Stronger, VIX Versus Stocks, BoC Recap — 1/17/18
Log-in here if you’re a member with access to the Closer.
Looking for deeper insight on markets? In tonight’s Closer sent to Bespoke Institutional clients, we review Apple’s capex plans, US industrial output, the disconnect between stocks and the VIX, and the BoC decision today.

See today’s post-market Closer and everything else Bespoke publishes by starting a 14-day free trial to Bespoke Institutional today!
Chart of the Day: Heed the Gap
B.I.G. Tips – One Way Markets
Looking back on the last six months of the S&P 500’s performance, it’s hard to overstate just how remarkable of a run it has been. There have definitely been periods where the S&P 500 rallied more (and many cases a lot more), but the nearly complete lack of downside pressure has been extraordinary. Just look at the chart below. There have only been two periods where the S&P 500 saw more than a 1% drawdown on a closing basis from a closing high, and the largest drawdown was just 2.2%!

There’s hardly been any downside pressure at all. In the chart below we calculated the cumulative amount of downside pressure in the S&P 500 on a rolling six-month basis going back to 1928. To do this, we simply added up the magnitude of the daily declines (measured in basis points where every 100 bps equals 1 percentage point) in the S&P 500 over a six-month rolling window. Heading into today, the cumulative impact of all the S&P 500’s down days over the last six months was a total of 1,230 bps.
How does that stack up relative to other periods? Let’s put it this way; since 1928, there have only been three other periods, which all spanned from 1964 through 1966, where the cumulative impact of down days over a six month period was less than the last six months. The most extreme of these periods was in May 1964, when the cumulative six-month downside impact was less than 1,000 bps. We often hear from people who are amazed at how sanguine the market can be in the midst of all the headlines surrounding Washington and the state of geopolitical affairs, but in the 1960s, the US saw more than a little bit of geopolitical and political turmoil as well! And just like today, in the 60s we saw long periods where the market did nothing but go up. This is a reason we always note that politics and investing don’t mix!

So what can we expect from the market after such an extended rally without much in the way of pullbacks? To help answer this question, we just published a report looking at 18 prior periods where the S&P 500 was closely correlated to the current period and analyzed the returns going forward.
For anyone interested in the trends we uncovered, this report is a must-read. To see it, sign up for a Bespoke Premium membership now!
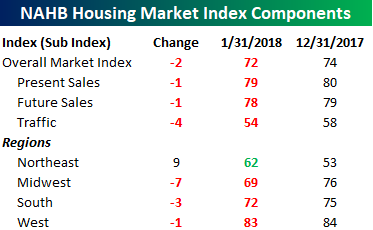
Homebuilder Sentiment Declines Inline With Expectations
Homebuilder sentiment took a little bit of a breather this week, but with last month’s report printing the highest level since 1999, the pullback was expected. In fact, the drop from 74 down to 72 in the NAHB was right in line with consensus expectations. Even at the current level, there haven’t been many other periods in the last 33 years where confidence was higher.

Looking at the breakdown of this month’s report for January, sentiment regarding Sales (both Present and Future) and Traffic all declined this month. While the overall levels did pullback this month, we would note that they are all still above levels they were at in November prior to the strong December reading, so, for now, it’s just a small step back from a big leap forward. On a regional basis, sentiment declined in every region of the country this month except the Northeast, where it hit a new high. You may recall that in last month’s update, we noted how the Northeast was the only region that saw a decline in sentiment. In other words, every category that increased last month decreased in January, and the only category that declines last month increased this month.

Fixed Income Weekly – 1/17/18
Searching for ways to better understand the fixed income space or looking for actionable ideals in this asset class? Bespoke’s Fixed Income Weekly provides an update on rates and credit every Wednesday. We start off with a fresh piece of analysis driven by what’s in the headlines or driving the market in a given week. We then provide charts of how US Treasury futures and rates are trading, before moving on to a summary of recent fixed income ETF performance, short-term interest rates including money market funds, and a trade idea. We summarize changes and recent developments for a variety of yield curves (UST, bund, Eurodollar, US breakeven inflation and Bespoke’s Global Yield Curve) before finishing with a review of recent UST yield curve changes, spread changes for major credit products and international bonds, and 1 year return profiles for a cross section of the fixed income world.
In this week’s note, we review the growing disconnect between global inflation and global yields.

Our Fixed Income Weekly helps investors stay on top of fixed income markets and gain new perspective on the developments in interest rates. You can sign up for a Bespoke research trial below to see this week’s report and everything else Bespoke publishes free for the next two weeks!
Click here and start a 14-day free trial to Bespoke Institutional to see our newest Fixed Income Weekly now!
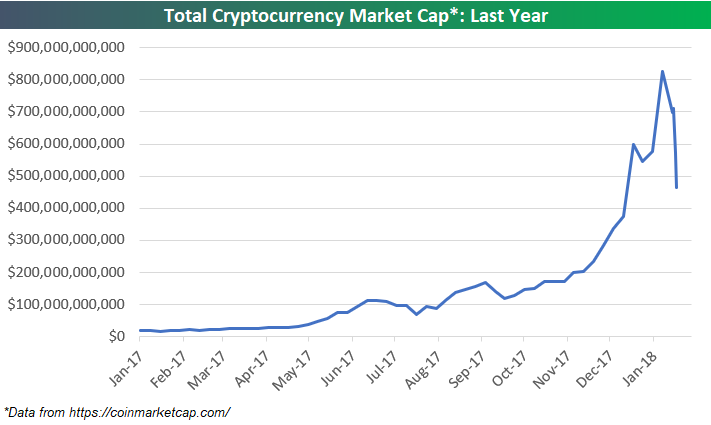
Crypto-Crash — Total Market Cap Down Nearly 50% in a Week
It has been a rough week for cryptocurrencies. Using data from coinmarketcap.com, below is a chart of total crypto market cap over the last year. After eclipsing the $800 billion mark in the first week of 2018, total crypto market cap has fallen 44% to below $500 billion over the last 10 days. Yes — a 44% drop in 10 days! A crash indeed.
Bespoke’s Global Macro Dashboard — 1/17/18
Bespoke’s Global Macro Dashboard is a high-level summary of 22 major economies from around the world. For each country, we provide charts of local equity market prices, relative performance versus global equities, price to earnings ratios, dividend yields, economic growth, unemployment, retail sales and industrial production growth, inflation, money supply, spot FX performance versus the dollar, policy rate, and ten year local government bond yield interest rates. The report is intended as a tool for both reference and idea generation. It’s clients’ first stop for basic background info on how a given economy is performing, and what issues are driving the narrative for that economy. The dashboard helps you get up to speed on and keep track of the basics for the most important economies around the world, informing starting points for further research and risk management. It’s published weekly every Wednesday at the Bespoke Institutional membership level.
You can access our Global Macro Dashboard by starting a 14-day free trial to Bespoke Institutional now!

The Closer — Open And Close Streaks, Inflation Expectations, Buck At New Lows — 1/16/18
Log-in here if you’re a member with access to the Closer.
Looking for deeper insight on markets? In tonight’s Closer sent to Bespoke Institutional clients, we take a look at prior strong open-close runs for the US equity market. We also take a look at New York Fed consumer survey data and the new lows for the USD.
See today’s post-market Closer and everything else Bespoke publishes by starting a 14-day free trial to Bespoke Institutional today!