Turning on a Dime
When you look back on the last three weeks, it really is quite amazing how quickly sentiment towards the market has shifted. In January, absolutely nothing could go wrong as all stocks could do was go up. Now, three weeks removed from the January peak, there’s been a definite shift in tone. While we are far (really far) from panic or bearishness, a fog of unease has definitely set in as investors fret over the Fed, rising interest rates, and inflation.
A look at intraday market performance also shows the shift in tone pretty clearly. The first chart below is an intraday composite of the S&P 500 from the start of the year through 1/26. The chart simply shows the S&P 500’s average performance relative to the prior day’s close at every point in the trading day. It’s basically what the “average” trading day has looked like this year. For the first three weeks and change of the year, investors couldn’t get enough of the stock market. The typical pattern in those first eighteen trading days of the year was a higher open with steady gains throughout the trading day. Barring a slight lull from 10:30 to 11:30 and then from 2:00 to 3:00 (ET), stocks just drifted higher.
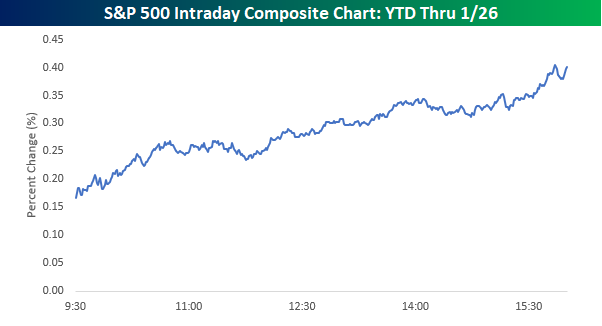
The picture of the S&P 500 in the 19 trading days since the peak couldn’t be more different. Rather than gapping up in the morning, the market has typically opened flat to lower and then trended lower all day. Volatility has definitely picked up as well. Whereas the chart above is nice and steady, the chart since the 1/26 peak below could just as well be the output of a cardiac device monitoring someone watching the intraday swings. Where the volatility has really picked up is late in the day when there have been sharp declines to the downside.
From time to time, we discuss the Smart Money Indicator which basically says that while the emotional ‘dumb’ money trades at the open, the more restrained and less emotional ‘smart’ money trades towards the end of the day. If that is the case, the shift in market tone is something bulls really need to focus on. While both the smart and dumb money were buying equities with both fists to kick off the year, since the 1/26 peak, the smart money has been selling. It has only been less than a month, but if the trend of the last few weeks and especially the last few days keeps up, it will be a big red flag from the Smart Money Indicator.

Bespokecast Episode 22 — Srinivas Thiruvadanthai — Now Available on iTunes, GooglePlay, Stitcher and More
 Our newest episode of Bespokecast is now available! Be sure to subscribe to Bespokecast on your preferred podcast app to gain access to our full collection of episodes. We’d also love for you to provide a review as well!
In this episode of Bespokecast, we talk to Jerome Levy Forecasting Center Managing Director and Director of Research Srinivas Thiruvadanthai. Srinivas is one of the most original and informed economic thinkers out there, and it was great to dive into his perspectives on profits, inflation, and monetary policy. Srinivas also shared some fascinating perspectives on higher education, his experience growing up in India, and the application of two of his pastimes – bridge and cricket – to analysis of the economy and markets. We also spend a large chunk of time discussing modern monetary theory and the Anglo-Saxon model of government. Please note, during the conversation we discuss the “profits perspective”, which you may want to read about in more detail. You can do so at this link. We also mention a talk from Professor Robert Putnam of Harvard’s Kennedy School of Public Policy. You can see that talk here.
To listen to our newest episode or subscribe to the podcast via iTunes, GooglePlay, OvercastFM, or Stitcher, please click the button or links below. Please note that third-party podcast feeds may update at a lag of a few hours to this blog post.

Economic Surprises Turn South in Europe
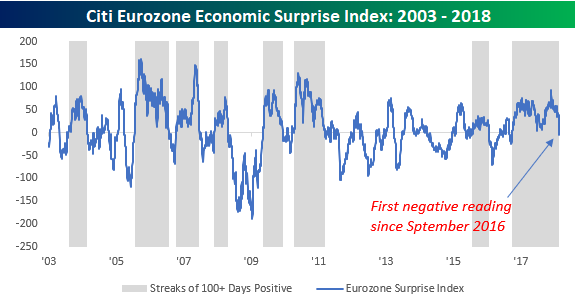
It was a disappointing week on the data front over in Europe. With almost across the board weakness in PMI indices, the Citi Economic Surprise Index for the region plummeted from over 20 earlier in the week to below zero on Wednesday. While the Citi Surprise indices tend to oscillate between positive and negative levels as expectations tend to get too positive when the data is good and too negative when the data is weak, the most recent dip into negative territory is notable due to the fact that it ended a streak of 358 straight days of positive readings. That’s right, the last time this indicator had a negative reading was in September 2016!
The chart below shows the historical readings of the Citi Economic Surprise Index for the European region with periods where the index was in positive territory shaded in gray. While streaks longer than 100 trading days going back to 2003 aren’t necessarily uncommon, the length of the most recent streak was by far the longest on record, exceeding the next longest streak (ending in July 2006) by nearly 100 trading days. So while it shouldn’t necessarily come as a surprise that the recent data was disappointing, the fact that it has been so long makes it feel all the more uncommon.
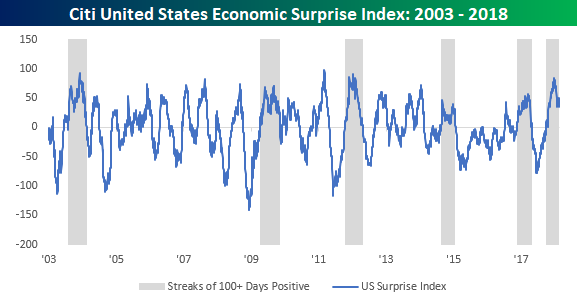
While economic data is starting to disappoint to the downside, data in the US continues to trend ahead of expectations. In fact, just this week, the Citi Economic Surprise Index for the US was positive for its 100th straight trading day. Going back to 2003, the current streak is just the sixth time that the US Surprise index has been positive for 100 or more trading days compared to eight for Europe. Another difference between the trends in the European and US surprise indices is that streaks of positive readings have been more prolonged in Europe than the US. Whereas there have been five positive streaks that lasted more than 150 trading days in Europe, just one in the US has lasted that long.
The Closer — Loonie Tunes, Crude Croons — 2/22/18
Log-in here if you’re a member with access to the Closer.
Looking for deeper insight on markets? In tonight’s Closer sent to Bespoke Institutional clients, we review Canadian economic growth and propose a trade based on that review. We also discuss today’s EIA crude data and recent energy price action.

See today’s post-market Closer and everything else Bespoke publishes by starting a 14-day free trial to Bespoke Institutional today!
Bespoke’s Sector Snapshot — 2/22/18
We’ve just released our weekly Sector Snapshot report (see a sample here) for Bespoke Premium and Bespoke Institutional members. Please log-in here to view the report if you’re already a member. If you’re not yet a subscriber and would like to see the report, please start a two-week free trial to Bespoke Premium now.
Below is one of the many charts included in this week’s Sector Snapshot, which highlights the percentage of stocks in each sector that are trading above their 50-day moving averages. As shown, the reading for the entire S&P 500 stands at just 42%, so there’s still quite a bit of work to do on the breadth side to get back above 50%. If it weren’t for Tech, overall breadth would look even worse.

To see our full Sector Snapshot with additional commentary plus six pages of charts that include analysis of valuations, breadth, technicals, and relative strength, start a two-week free trial to our Bespoke Premium package now. Here’s a breakdown of the products you’ll receive.
B.I.G. Tips – Leading Indicators Accelerate
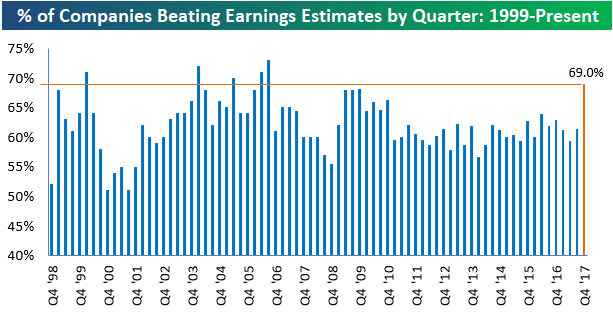
Strongest Earnings Beat Rate Since Q3 2006
Yesterday we sent Bespoke members a full rundown of results from the just-completed earnings season. To view the report, start a Bespoke Premium free trial here. One stat we can highlight here is the earnings beat rate from this season. As shown below, the percentage of companies that reported EPS that were stronger than consensus analyst estimates came in at 69%. For those keeping score, that’s the strongest beat rate since Q3 2006, and the sixth strongest beat rate over the last 20 years.
You might remember that analysts were hiking their EPS estimates at a record pace heading into the most recent earnings season, which makes the extremely strong beat rate (relative to recent earnings seasons) even more impressive.
the Bespoke 50 — 2/22/18
Every Thursday, Bespoke publishes its “Bespoke 50” list of top growth stocks in the Russell 3,000. Our “Bespoke 50” portfolio is made up of the 50 stocks that fit a proprietary growth screen that we created a number of years ago. Since inception in early 2012, the “Bespoke 50” has beaten the S&P 500 by 63.3 percentage points. Through today, the “Bespoke 50” is up 159.9% since inception versus the S&P 500’s gain of 96.6%. Always remember, though, that past performance is no guarantee of future returns.
To view our “Bespoke 50” list of top growth stocks, click the button below and start a trial to either Bespoke Premium or Bespoke Institutional.

Chart of the Day: Bond Selloff Looks Stretched
Investor Sentiment Little Changed
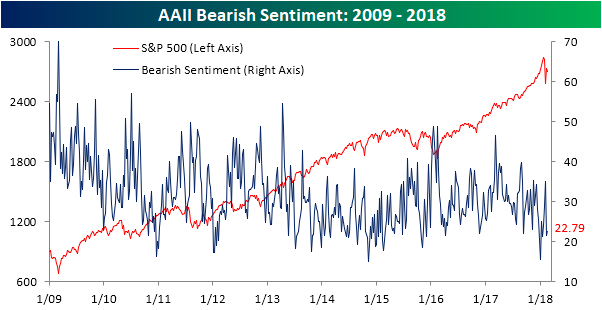
In a week that was shortened by a holiday, not to mention one where a lot of people are on vacation, it should come as no surprise that individual investor sentiment was little changed. Add to that the fact that the market was just down modestly since the prior week’s survey results, and you have all the ingredients for a relatively boring report. According to the weekly survey from AAII, bullish sentiment on the part of individual investors dropped from 48.52% down to 44.65%, which is right in line with levels we have seen in recent weeks.
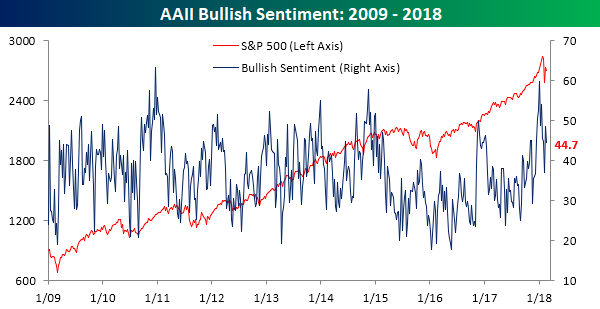
Similarly, bearish sentiment saw little in the way of change this week, rising from 21.4% up to 22.8%. Like we said, it was a pretty boring week of survey results, but after all the volatility from late January and early February, boring is good!