The Closer: End of Week Charts — 3/2/18
Looking for deeper insight on global markets and economics? In tonight’s Closer sent to Bespoke clients, we recap weekly price action in major asset classes, update economic surprise index data for major economies, chart the weekly Commitment of Traders report from the CFTC, and provide our normal nightly update on ETF performance, volume and price movers, and the Bespoke Market Timing Model. This week, we’ve added a section that helps break down momentum in developed market foreign exchange crosses.

The Closer is one of our most popular reports, and you can sign up for a free trial below to see it!
See tonight’s Closer by starting a two-week free trial to Bespoke Institutional now!
S&P 500 Quick-View Chart Book — 3/2/18
Speculators Unload Crude
Oil prices have bounced back a lot, despite recent softer price action that sees crude near $60. That’s put near-month crude at a hefty premium to out-months, a so-called backwardation of the WTI curve. As shown in the chart below, the ~10% premium for front-month over year-ahead crude is about as high as it’s gotten over the past decade or so. The price differential provides a huge incentive for investors to supply crude to the market by selling spot crude and buying out-months. That creates a positive yield. The opposite was true in the period when the WTI curve was in contango; investors had an incentive to buy spot and sell out-months, driving up inventories. As shown in the chart below, while inventories and the shape of the crude curve are not perfectly correlated, they’ve got a very close relationship. As long as out-months remain at a discount to the front of the curve, don’t be surprised to see global stockpiles continue to shrink.

Global Equities At New Lows
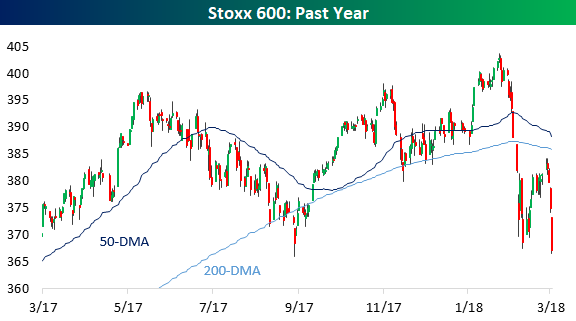
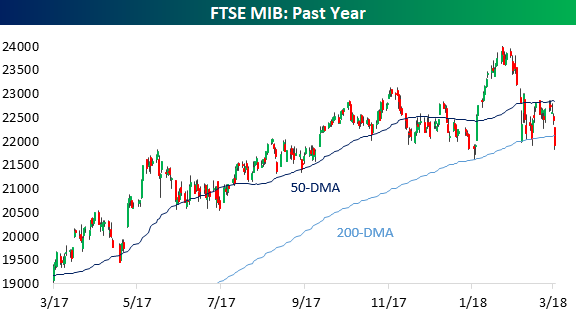
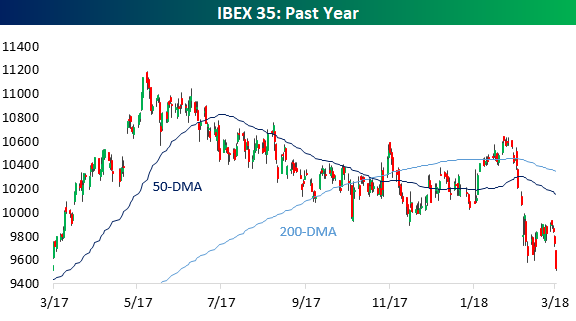
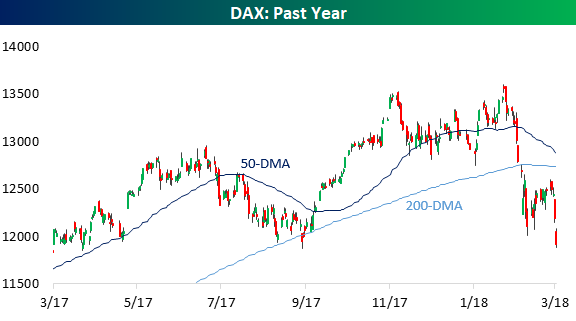
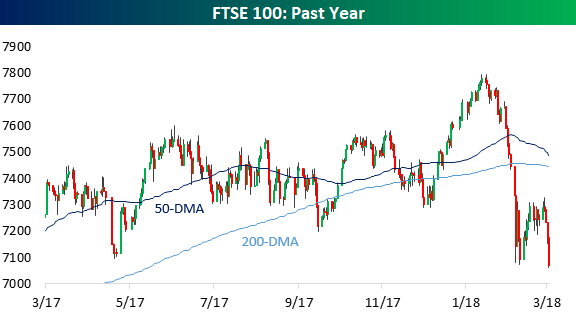
US equities have had a bit of a bad week with 1% declines on Tuesday, Wednesday, and Thursday and the Dow now negative on the year. While that’s a rough run, local currency prices for equities in in the rest of the world are also in tough. Below we show charts for Europe (Stoxx 600), Italy (FTSE MIB), Spain (IBEX 35), Germany (DAX), UK (FTSE 100), and Japan (Nikkei 225). All 5 of those European indices are now below their 200-DMAs, with all but Italy at new closing 52-week lows. The Nikkei 225 is also right at its 200-DMA. In short, local equity markets around the world are not performing very well in local currency terms. For US investors, it’s less painful; the dollar’s drop versus EUR, GBP, and JPY over the past year means performance is much stronger.
Mega Caps Underperforming on Trade War Sell-Off
Trump’s tariff announcement yesterday sent US equities reeling on trade war fears. A trade war would presumably impact the largest global companies much more than smaller cap, more domestically-oriented ones. In terms of stock price performance, it seems that investors agree with this presumption.
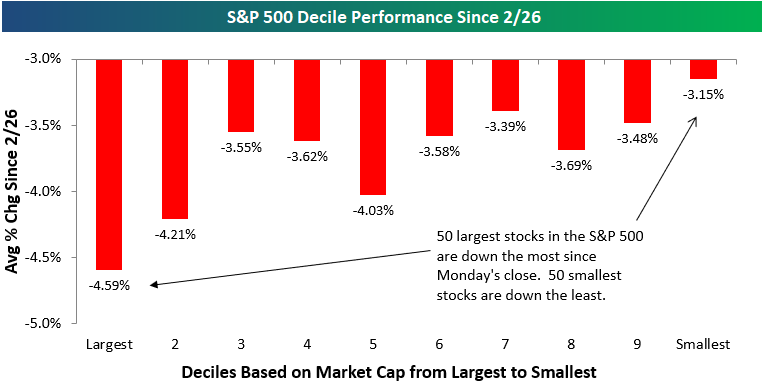
We ran our decile analysis on the S&P 500 based on market cap to see how the largest vs. smallest stocks in the index have performed during the sell-off that began on Tuesday. To run the analysis, we broke the index into deciles (10 groups of 50 stocks each) based on market cap, and then we calculated the average performance of the stocks in each decile since Monday’s close.
As shown below, the 50 largest stocks in the S&P 500 are down an average of 4.59% during this sell-off, which is easily the worst performing decile of the group. The average stock in the S&P 500 is down 3.73% since Monday’s close, so the 50 largest stocks are underperforming the average by 86 basis points. Conversely, the 50 smallest stocks in the S&P are down just 3.15% during the sell-off, which is the best performing decile of the group.
Given that the S&P 500 is a market cap weighted index, the largest stocks have a bigger impact on its price movement. When the largest stocks get hit the hardest as has been the case on this trade-war sell-off, it weighs heavily on the S&P. But on an equal-weighted basis, things don’t look quite as bad.
The Closer — Tariff Trouble, Auto Rubble, 2% Core PCE On The Double! — 3/1/18
Log-in here if you’re a member with access to the Closer.
Looking for deeper insight on markets? In tonight’s Closer sent to Bespoke Institutional clients, we break down what the announcement of new tariffs by the White House today means. We also discuss weak auto sales and strong inflation.

See today’s post-market Closer and everything else Bespoke publishes by starting a 14-day free trial to Bespoke Institutional today!
Bespoke’s Sector Snapshot — 3/1/18
We’ve just released our weekly Sector Snapshot report (see a sample here) for Bespoke Premium and Bespoke Institutional members. Please log-in here to view the report if you’re already a member. If you’re not yet a subscriber and would like to see the report, please start a two-week free trial to Bespoke Premium now.
Below is one of the many charts included in this week’s Sector Snapshot, which highlights the percentage of stocks in the S&P 500 that are trading above their 50-day moving averages. At just 25%, the current reading is very weak for market breadth.

To see our full Sector Snapshot with additional commentary plus six pages of charts that include analysis of valuations, breadth, technicals, and relative strength, start a two-week free trial to our Bespoke Premium package now. Here’s a breakdown of the products you’ll receive.
Strong ISM Manufacturing With an Inflation Aroma
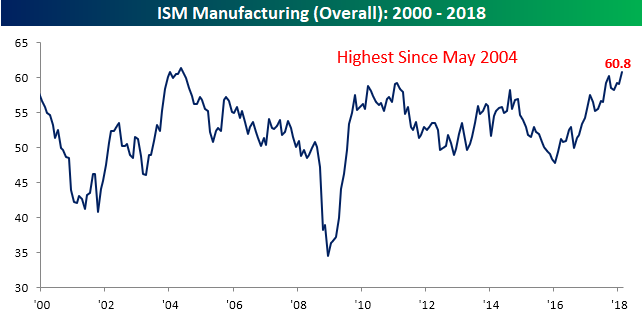
The February ISM Manufacturing report for the Manufacturing sector came in much stronger than expected and rose to a level of 60.8 compared to last month’s reading of 59.1 and consensus expectations that were calling for a decline to 58.7. As shown in the chart below, February’s reading was the strongest for the headline index since May 2004. It’s hard not to like that!
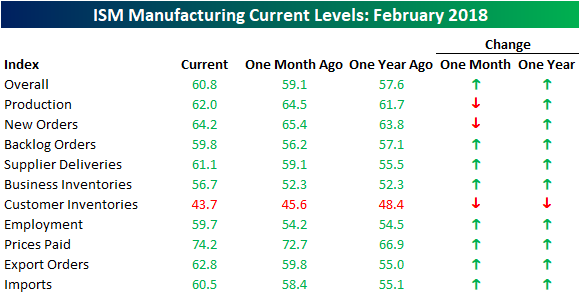
While the headline reading was positive, not all the news was good. The table below shows the breakdown of this month’s sub-indices on both a m/m and a y/y basis. One thing that stands out is that breadth in the report was strong. On a m/m basis, all but three components increased, and on a y/y basis Customer Inventories was the only category that showed a decline. That’s the good news. The bad news is that two of the three categories that declined on a m/m basis in February were Production and New Orders. These are two categories that we typically like to see increasing, and February’s drops represent the second straight month of declines for each sub-index. More important than those declines, however, is the fact that Price Paid rose to its highest level since May 2011 (chart below). With the markets already on edge about potential inflation pressures, this was not welcome news.

A look at the commentary in this month’s report stinks even more of inflation and potential price pressures. Of the ten quotes highlighted in the report, seven of them discuss issues like lead times, contraints, tight labor markets, suppliers out of inventory, supplier price increases, etc. The usual way to alleviate these issues is simple- higher prices. Whether and how much they actually translate to higher prices, remains to be seen, but for a market already worried about the potential for upside price pressures, these aren’t welcome comments.
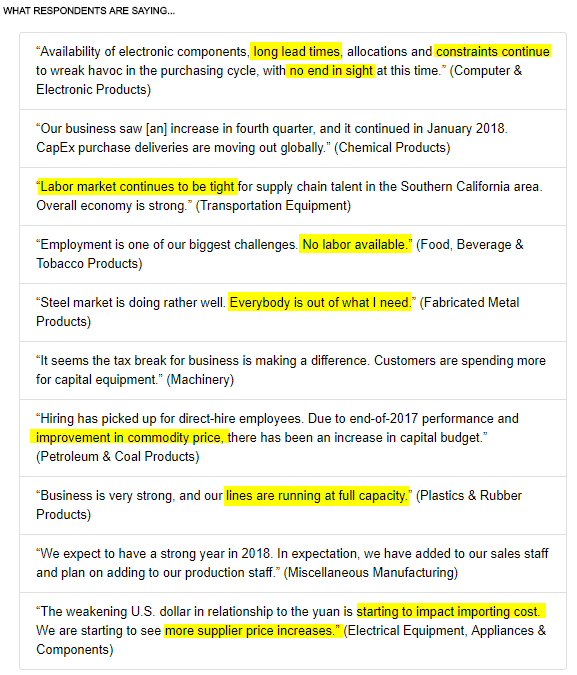
Chart of the Day: Autos To Miss In February
the Bespoke 50 — 3/1/18
Every Thursday, Bespoke publishes its “Bespoke 50” list of top growth stocks in the Russell 3,000. Our “Bespoke 50” portfolio is made up of the 50 stocks that fit a proprietary growth screen that we created a number of years ago. Since inception in early 2012, the “Bespoke 50” has beaten the S&P 500 by 57.3 percentage points. Through today, the “Bespoke 50” is up 154.5% since inception versus the S&P 500’s gain of 97.2%. Always remember, though, that past performance is no guarantee of future returns.
To view our “Bespoke 50” list of top growth stocks, click the button below and start a trial to either Bespoke Premium or Bespoke Institutional.
