Fixed Income Weekly – 1/31/18
Searching for ways to better understand the fixed income space or looking for actionable ideals in this asset class? Bespoke’s Fixed Income Weekly provides an update on rates and credit every Wednesday. We start off with a fresh piece of analysis driven by what’s in the headlines or driving the market in a given week. We then provide charts of how US Treasury futures and rates are trading, before moving on to a summary of recent fixed income ETF performance, short-term interest rates including money market funds, and a trade idea. We summarize changes and recent developments for a variety of yield curves (UST, bund, Eurodollar, US breakeven inflation and Bespoke’s Global Yield Curve) before finishing with a review of recent UST yield curve changes, spread changes for major credit products and international bonds, and 1 year return profiles for a cross section of the fixed income world.
In this week’s note, we review the interest rates implied by BTC futures curves.

Our Fixed Income Weekly helps investors stay on top of fixed income markets and gain new perspective on the developments in interest rates. You can sign up for a Bespoke research trial below to see this week’s report and everything else Bespoke publishes free for the next two weeks!
Click here and start a 14-day free trial to Bespoke Institutional to see our newest Fixed Income Weekly now!
Bespoke’s Global Macro Dashboard — 1/31/18
Bespoke’s Global Macro Dashboard is a high-level summary of 22 major economies from around the world. For each country, we provide charts of local equity market prices, relative performance versus global equities, price to earnings ratios, dividend yields, economic growth, unemployment, retail sales and industrial production growth, inflation, money supply, spot FX performance versus the dollar, policy rate, and ten year local government bond yield interest rates. The report is intended as a tool for both reference and idea generation. It’s clients’ first stop for basic background info on how a given economy is performing, and what issues are driving the narrative for that economy. The dashboard helps you get up to speed on and keep track of the basics for the most important economies around the world, informing starting points for further research and risk management. It’s published weekly every Wednesday at the Bespoke Institutional membership level.
You can access our Global Macro Dashboard by starting a 14-day free trial to Bespoke Institutional now!

The Closer — Another AMZN Story, Homeownership + Prices Surge, Red Screens — 1/30/18
Log-in here if you’re a member with access to the Closer.
Looking for deeper insight on markets? In tonight’s Closer sent to Bespoke Institutional clients, we take a look at the latest attention-grabbing Amazon initiative, updated US homeownership and household formation data, a wild day in the markets, and the January print for Conference Board Consumer Confidence.

See today’s post-market Closer and everything else Bespoke publishes by starting a 14-day free trial to Bespoke Institutional today!
Two-Year Yield on Auto-Pilot
Lately, we’ve been highlighting a number of crazy streaks involving the steadiness of equities in the last several months, but have you seen a chart of the two-year yield lately? While the yield had its share of ups and downs during the first three quarters of 2017, ever since then it has been on auto-pilot to the upside, rising from 1.4% up to over 2%. Looking at this chart, there has been a consistent gap between the current yield and its 50-day moving average to the point where the yield has finished each of the last 98 trading days at least one standard deviation above that level.
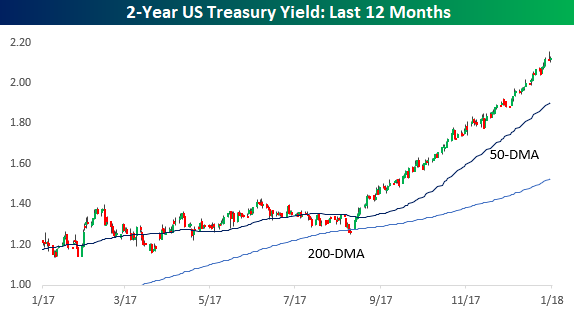
Look at the chart above again, because it’s unlikely you will ever see anything like it in a long time, at least if the last 40+ years is any indication. That’s because there has never been a time in the two-year Treasury’s history where it has been more than one-standard deviation above its 50-DMA for this long. Conversely, there has never been a streak where the yield on the two-year was this far below its 50-DMA for this long either.
The chart below shows historical streaks (in trading days) where the two-year US Treasury yield was more than one standard deviation above its 50-DMA or more than one standard deviation below it. In terms of closes above that level, the longest streak prior to the current one was back in 1994 when there were actually two back to back streaks of 70+ trading days. If you don’t remember 1994, it was another period where short-term interest rates steadily rose from just under 4% to just under 8% following a long period of dormancy. That increase in rates culminated with the bankruptcy of Orange County, California in December 1994. On the downside, the longest streak where the yield on the two-year closed more than one standard deviation below its 50-DMA ended in January 1985 during a period where the yield declined from close to 12% to just under 10%.

B.I.G. Tips — Fed Days January 2018
S&P 500 Performance Following State of the Union Speeches
A number of people have asked, so we wanted to provide a quick summary of how the S&P 500 has historically performed following State of the Union speeches by US Presidents since 2001. Given that the speeches take different tones depending on the President and where each one was at in their term, not to mention the state of the economy, it’s hard to say that this speech has any real direct impact on the overall market. Therefore, we would take the performance numbers with a grain of salt.
With that caveat, the one-week period stands out for its overall weakness, while the one-month period has been relatively strong. In the week that has followed SOTU speeches, the S&P 500 saw an average decline of 1.0% with gains in just 6 of the last 17 years. Regardless of who the President was, the S&P 500 has been down more often than it has been up. While one-week returns have generally been negative, one-month returns have been much more positive. Since 2001, the S&P 500 has seen an average gain of 0.74% (median: 1.16%) in the month after a SOTU speech with positive returns in all but four years. Under President Obama, the gains were even stronger with the S&P 500 having a median gain of 3.16% and only one year where it was down a month later. Thanks Obama!

Chart of the Day – Record Bullishness on US Stocks
Bespoke Stock Scores — 1/30/18
Streaks Are Made to Be Broken
With yesterday’s 0.67% decline for the S&P 500, the index ended a streak of 99 trading days without a decline of just 0.60% or more. As shown in the chart below, that’s the longest streak on record! If you needed further evidence that this market has been unbelievable lately, there you have it.

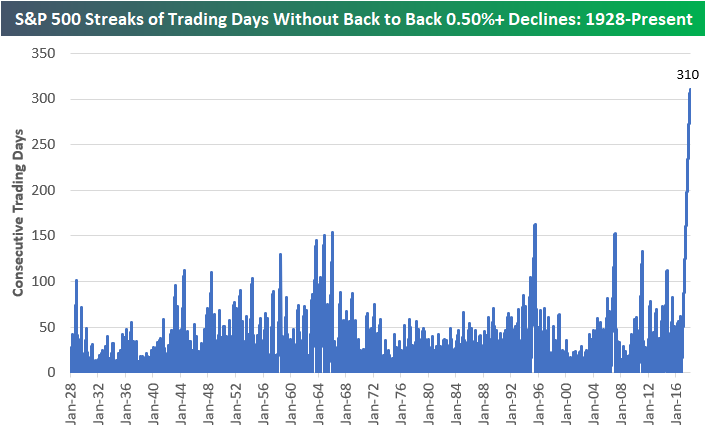
Another streak that’s just as — if not more — unbelievable is that the S&P 500 has now gone 310 trading days without experiencing back-to-back declines of 0.50%+. Think about that — it has been 310 trading days dating back more than a year to November 2nd, 2016 (just before the election) since we had two days in a row of declines of just half a percent.
As shown below, the current streak of 310 trading days — which may actually be broken today — is double the length of the 2nd longest streak without back-to-back declines of 0.50%+.
We’ve been saying it for the last few weeks now, but we’ll say it again — when the market does finally experience a pullback, it’s going to feel exponentially more painful for investors because of the simple fact that we haven’t experienced any kind of meaningful pullback in so long. And when emotions run higher than normal, it makes investors more eager to push the sell button. This in turn can cause even bigger declines, and the feedback loop begins.
The Closer — Capexpectations Surge, EM Performance, Savings Low — 1/29/18
Log-in here if you’re a member with access to the Closer.
Looking for deeper insight on markets? In tonight’s Closer sent to Bespoke Institutional clients, we review capex plans from US manufacturers, the benefits of the lower dollar for EM asset performance, and a review of the declining US household savings rate.
See today’s post-market Closer and everything else Bespoke publishes by starting a 14-day free trial to Bespoke Institutional today!